New Year’s Accomplishments, Collection of Data Art Projects!
Also Gifts, Plastic Rings, Rats, Sports, and Dungeons and Dragons!

Christmas and New Year’s Time! 🎄
A wonderful season to reflect on the past year, plan ahead, and dream while listening to the gentle whisper of snowflakes outside the window. ❄️
Yes, yes! This year I was lucky—the first days of January were magically snowy! Everything looks beautiful, even if cars struggle to get through.
Have You Counted Your DataViz Projects This Year? 📊✨
If not, take a moment to do it! Maybe even create a simple sketch or visualization (or a sketch of a visualization!). Does it feel like the year was uneventful? Scroll through your social media—you’ll likely find several achievements hiding there.
This year, I was lucky to give many lectures and create numerous data art projects. I’m so proud of myself! 🥰 Though, honestly, before counting, I felt like I hadn’t accomplished much at all...
So don’t dismiss this little exercise—our memories fade quickly, and celebrating yourself is important. It’ll help you climb even higher next year!
Other Things You Can Count:
Books you’ve read
Series you’ve watched
Trips you’ve taken
Meetings with friends
New people you’ve met!
Sending hugs and wishing you all a Happy New Year! ❤️
Flowers & Numbers - News!
Data Art Meetup!
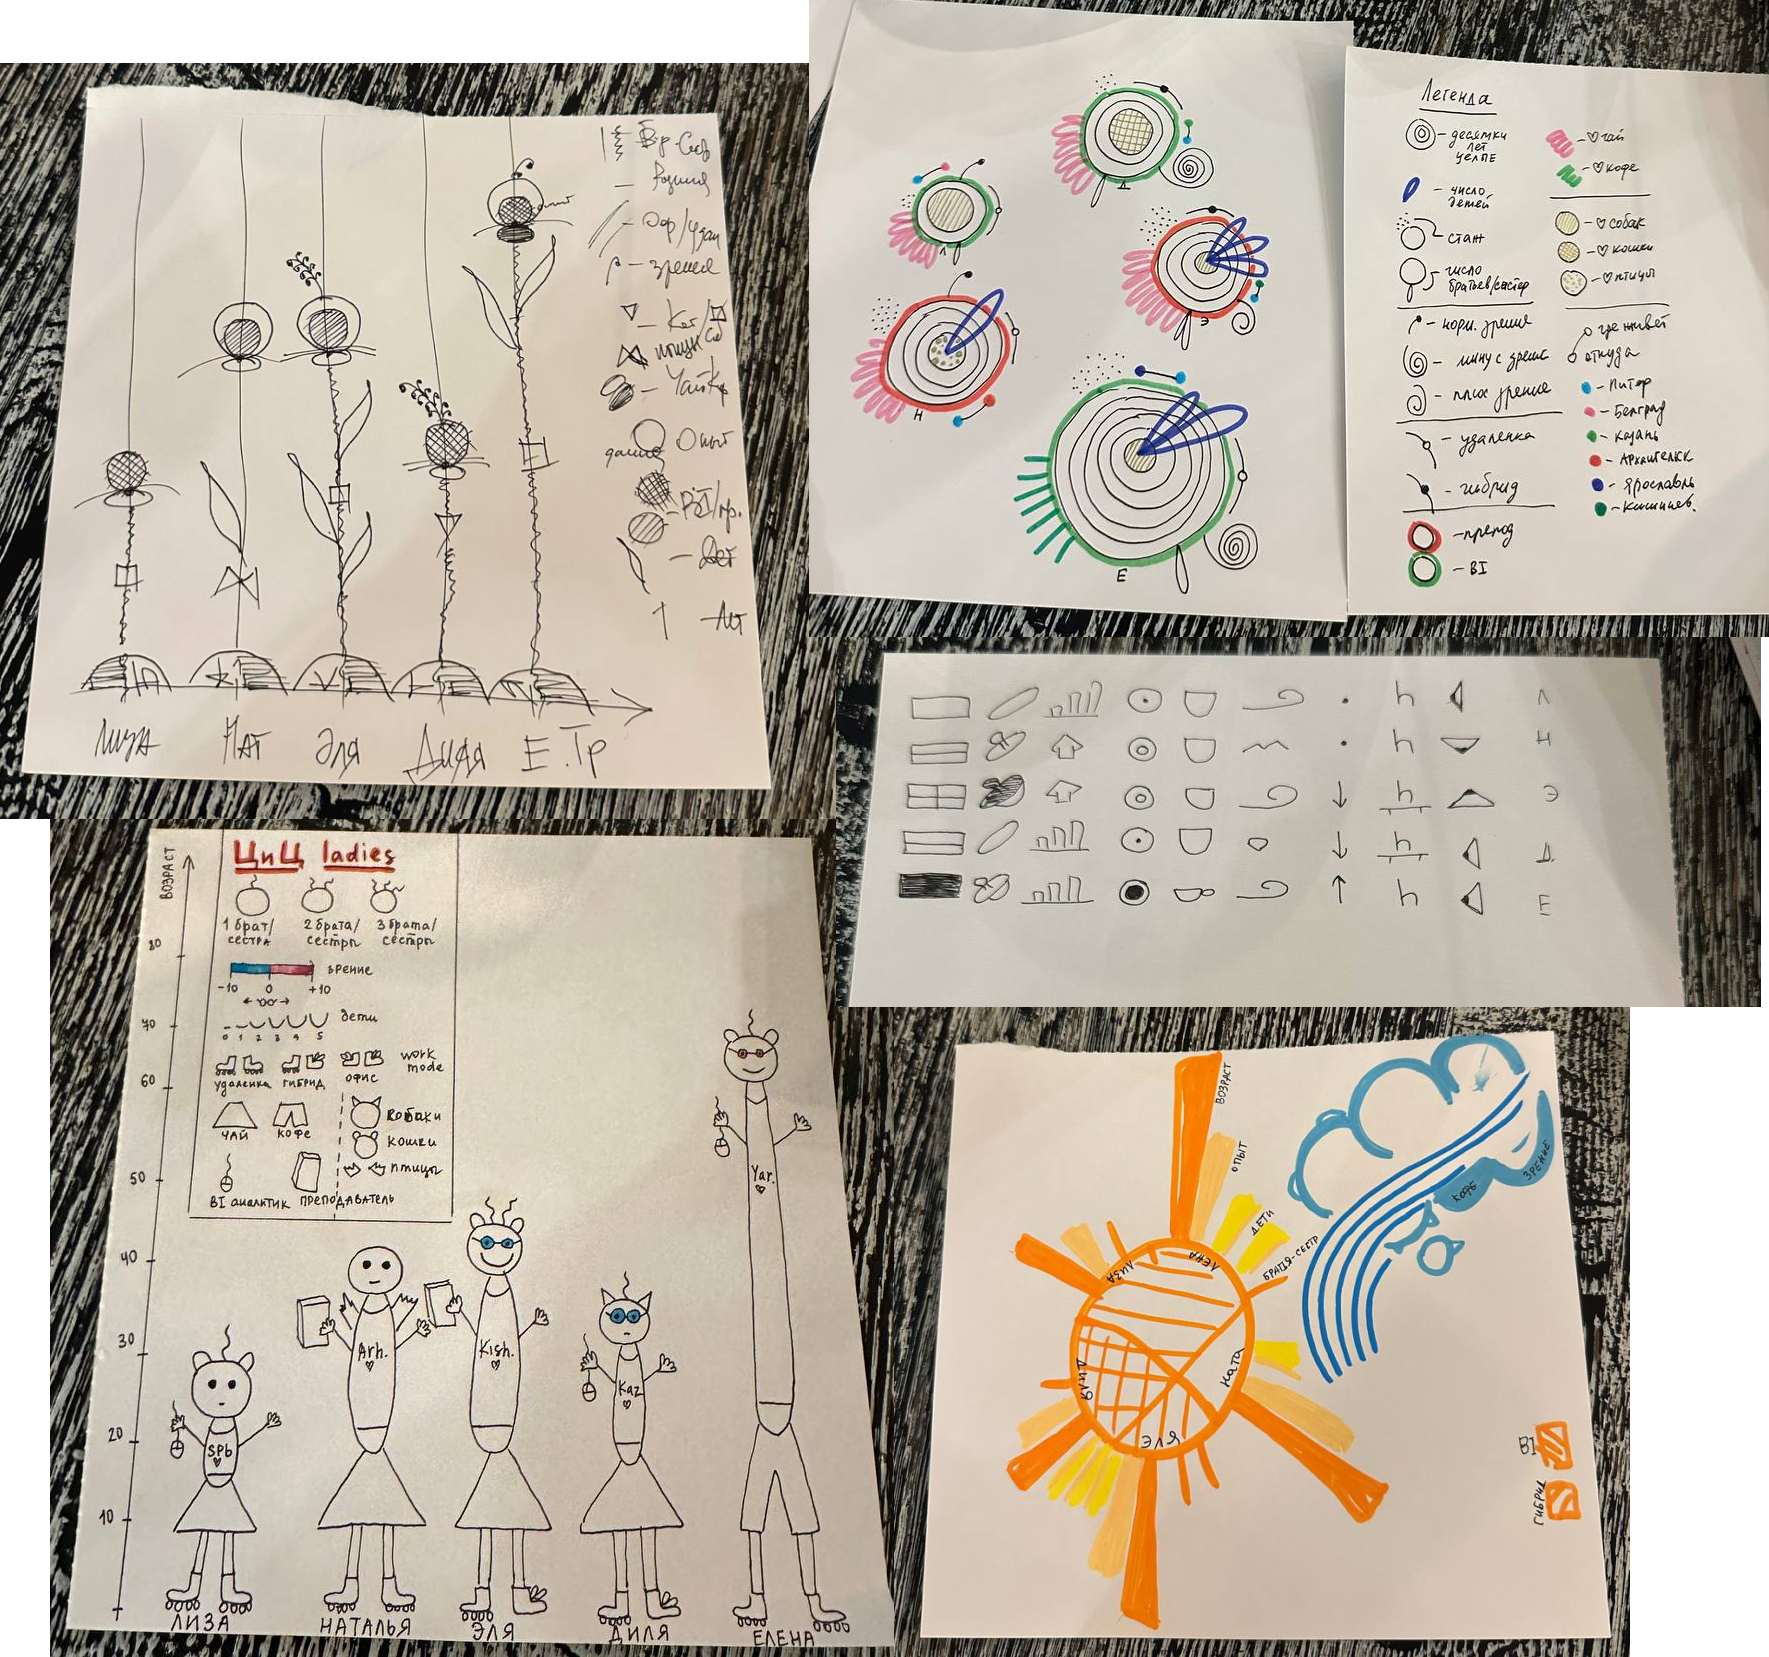
Yesterday, we had a wonderful data art meetup! Members of the Flowers and Numbers community gathered at a café, chatted, and created small personal data art pieces. We should meet more often!
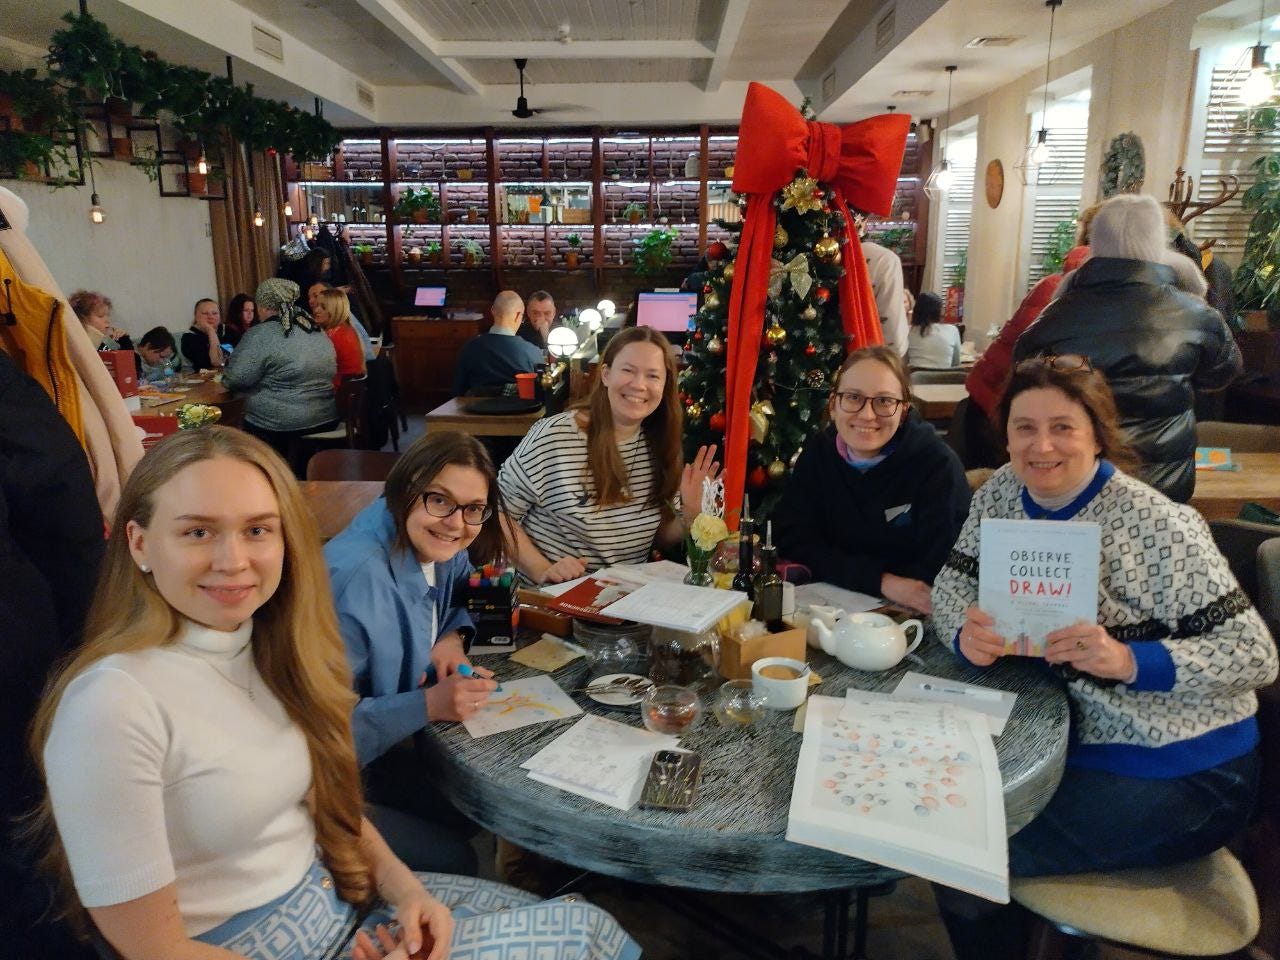
We encoded data such as age, experience, number of children, cities, interests, work focus, and more. The atmosphere was fantastic! It’s amazing to meet people from different fields united by a passion for data art.
The Week of Creativity! 🎨✨
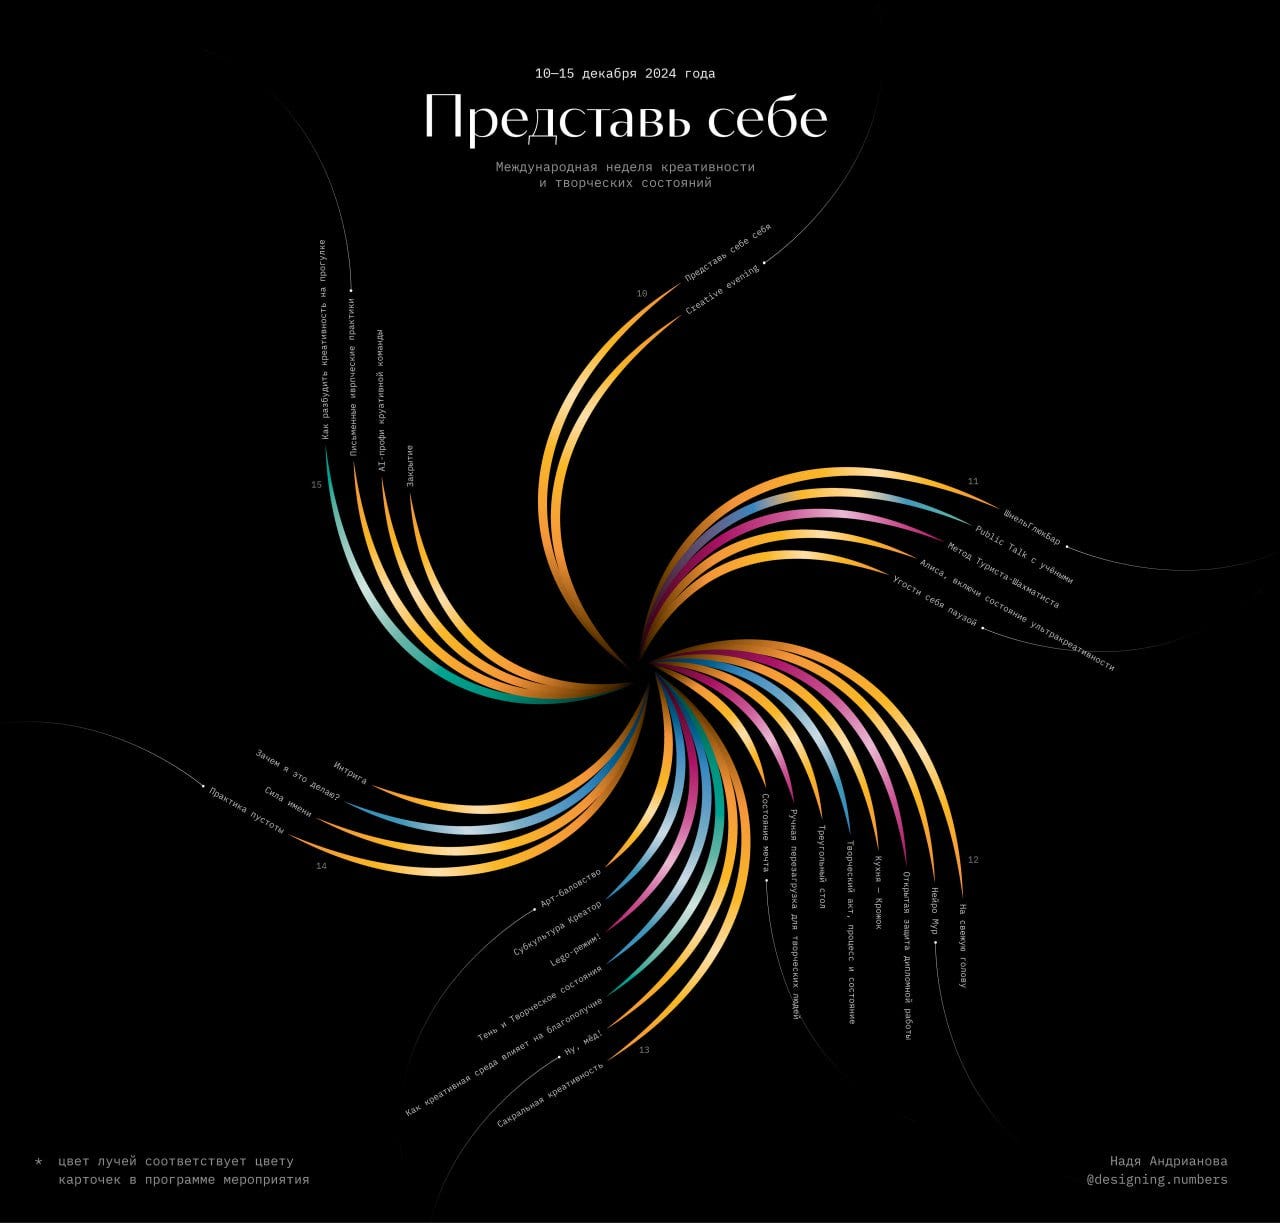
Nadya Andrianova from our community joined the Week of Creativity (Link)—an initiative where experts from different fields share practices to help creative people stay inspired and avoid burnout.
At the opening event, she briefly introduced data art and, as a spontaneous touch, created an abstract and beautiful version of the schedule overnight to showcase her craft. 😊
World Data Art News
Data Advent Calendar
Check out the beautiful Data Advent Calendar by Artisan Embroidery! Aren’t knitted data visualizations just wonderful? 😊
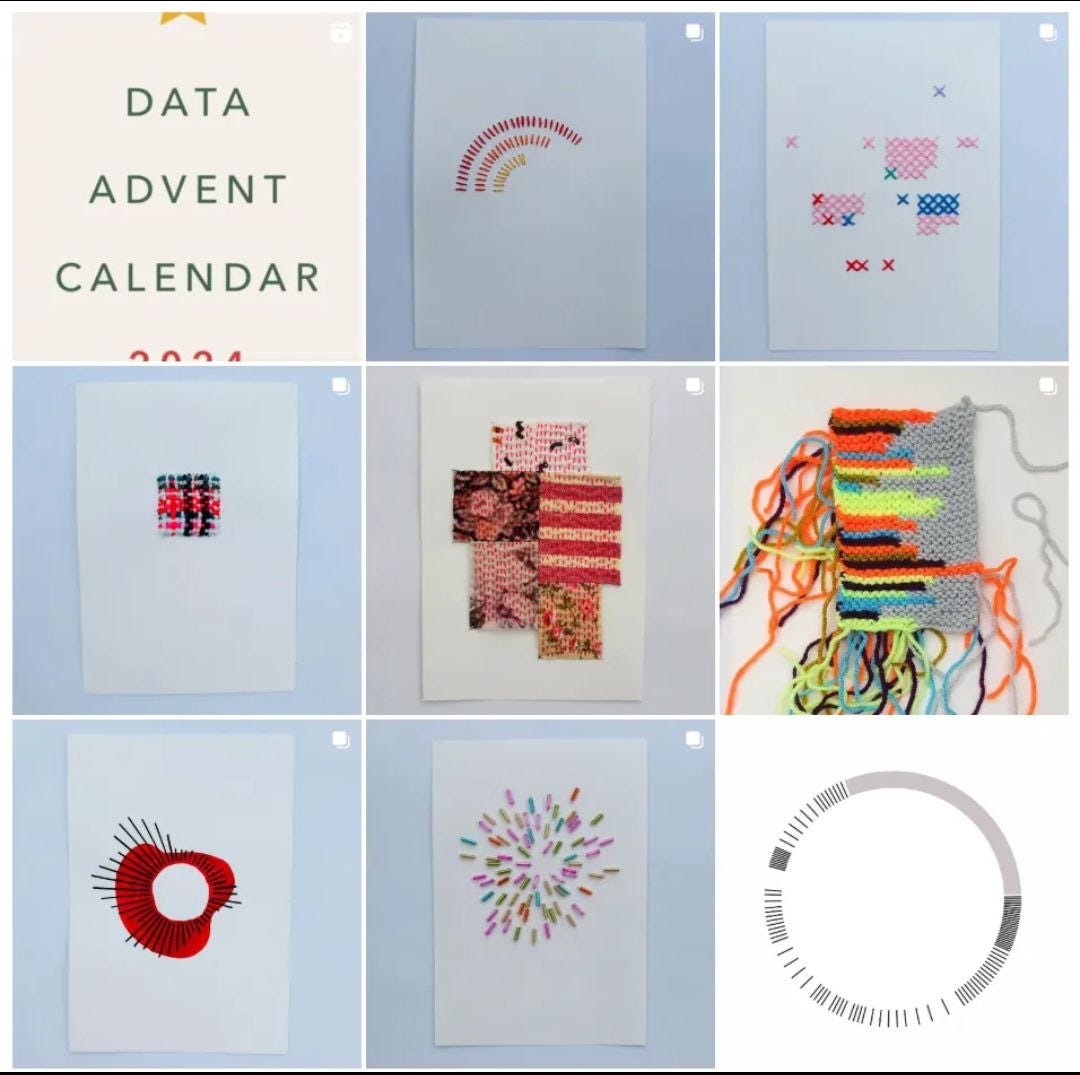
Tableau Public 2024 & 1 000 000 vizes!
Check the Tableau Blog! Over the year, more than 1 million visualizations were published on the platform—a staggering number. Two years ago, the community surpassed 8 million visualizations.
Key topics: the 2024 Olympics, movies, sports, business, and global trends.
The blog featured a Curated Collection of 49 visualizations and the 24 most popular visualizations of 2024.
There are many beautiful data art projects!
Thanks to Alex for the news and pic!

Gifts! 🎁✨
A dashboard by Alena Kotovich for #MakeoverMonday!
This is a little New Year’s postcard for the Tableau community—a dataset about Christmas gifts. 🥰
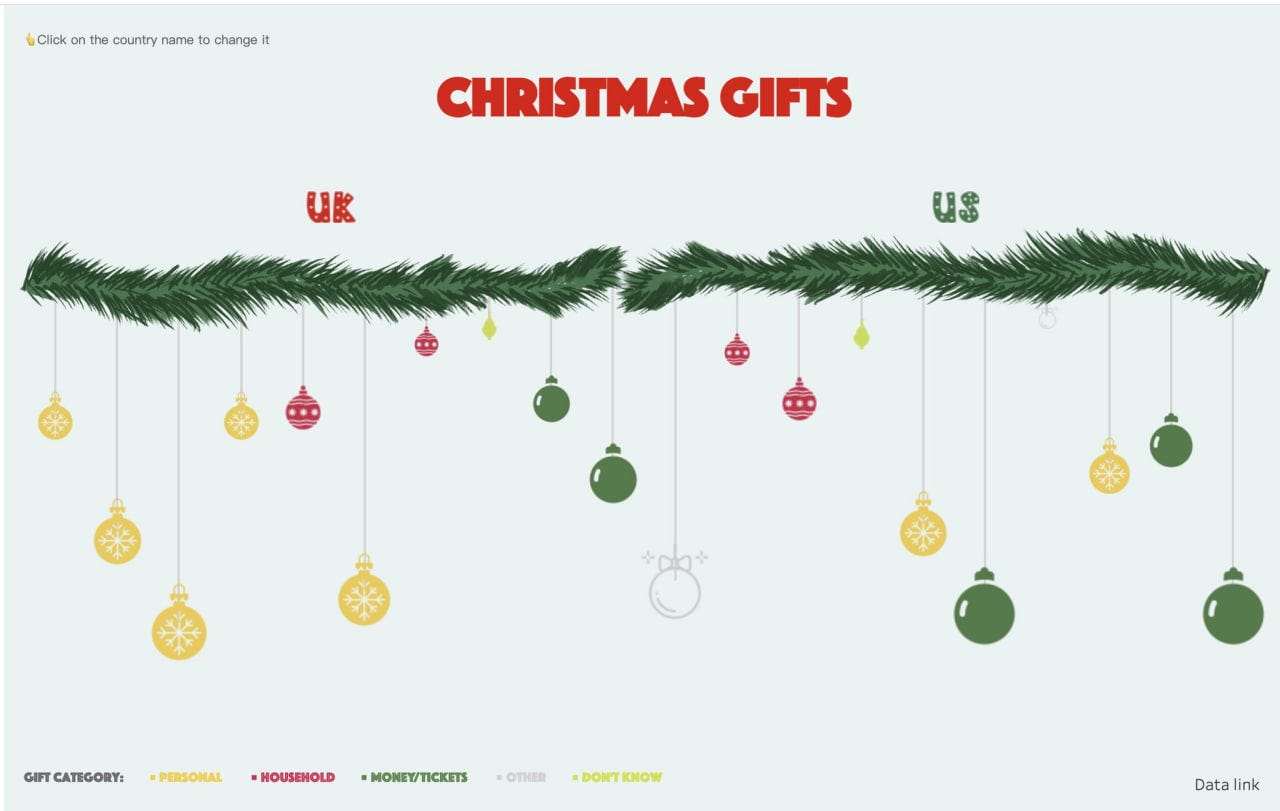
Interactive version: Link
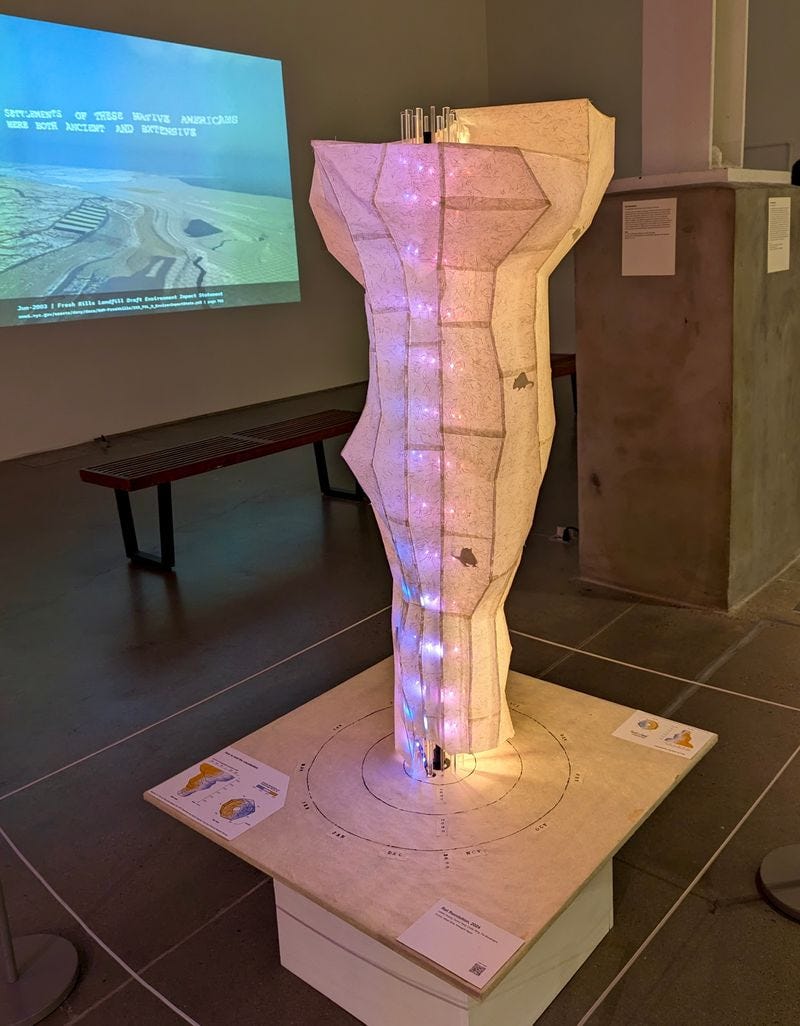
Rat Revolution! 🐀✨
This physical data art project explores the rising rat population in New York City.
Check out the full article on Nightingale: Link
Project details here: Link!
Authors: Danny Yang, Lesley Huang, Linda Yang, Pia Bocanegra!
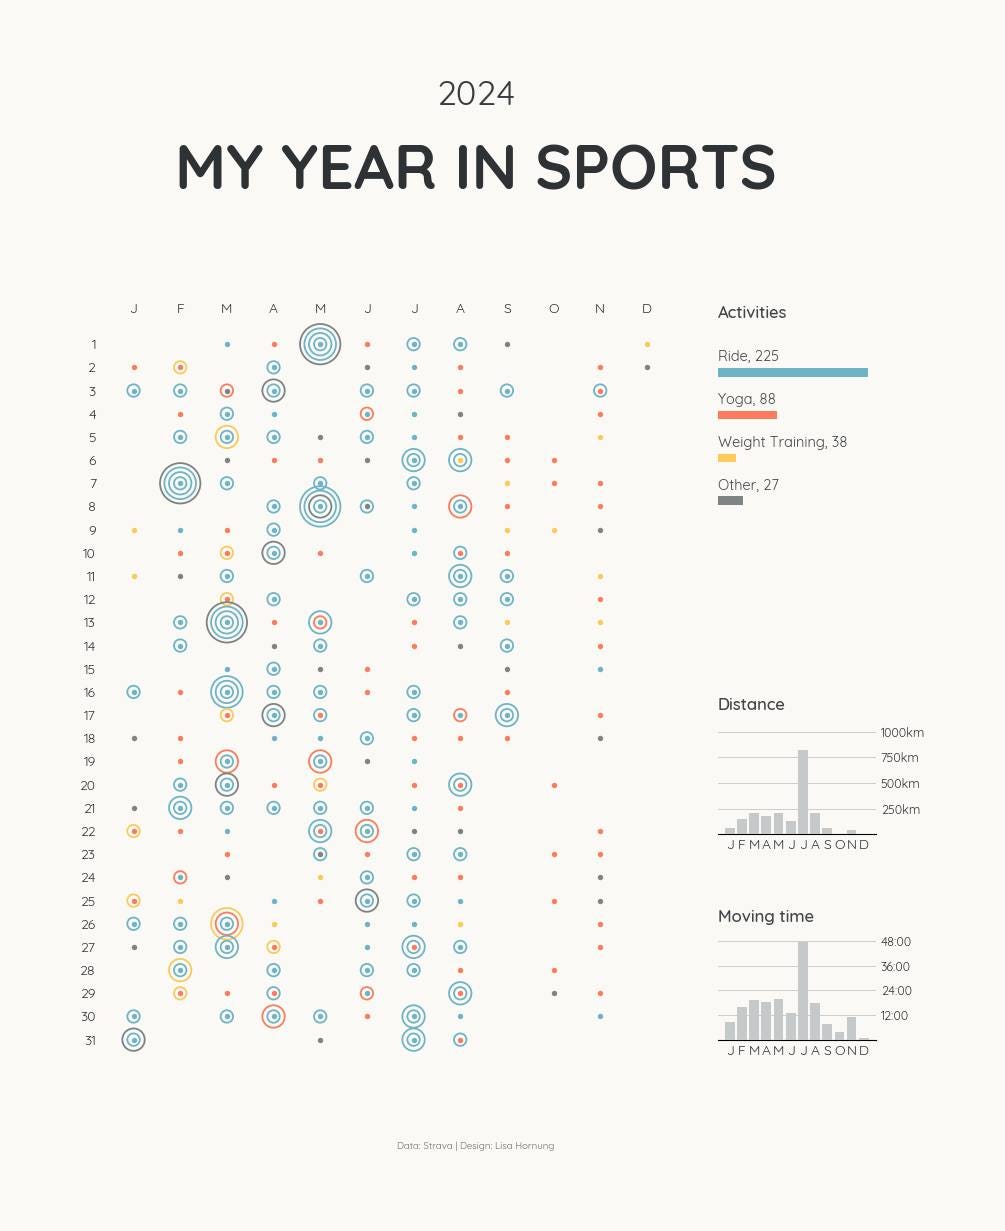
Your Year in Sports! 🚴✨
Lisa Hornung created a mini-app (Link) where you can upload your Strava data and get a visualization of your sports year.
Check out her example here: Link!
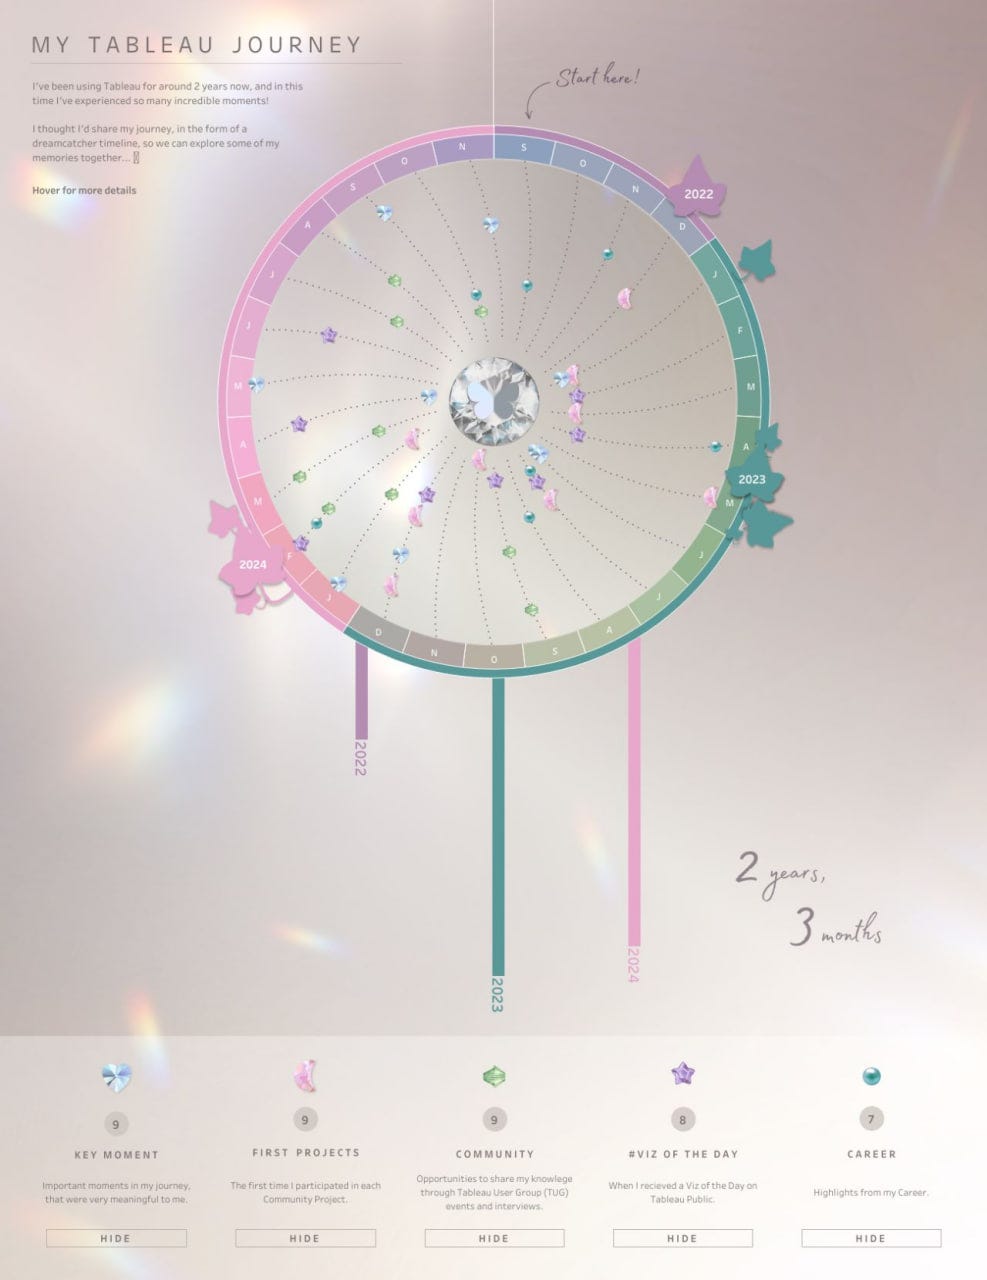
Shreya Arya's Personal Tableau Journey! 🥰✨
A heartwarming visualization of her Tableau path over 2 years and 3 months.
Check it out here: Link!
More Data Art!
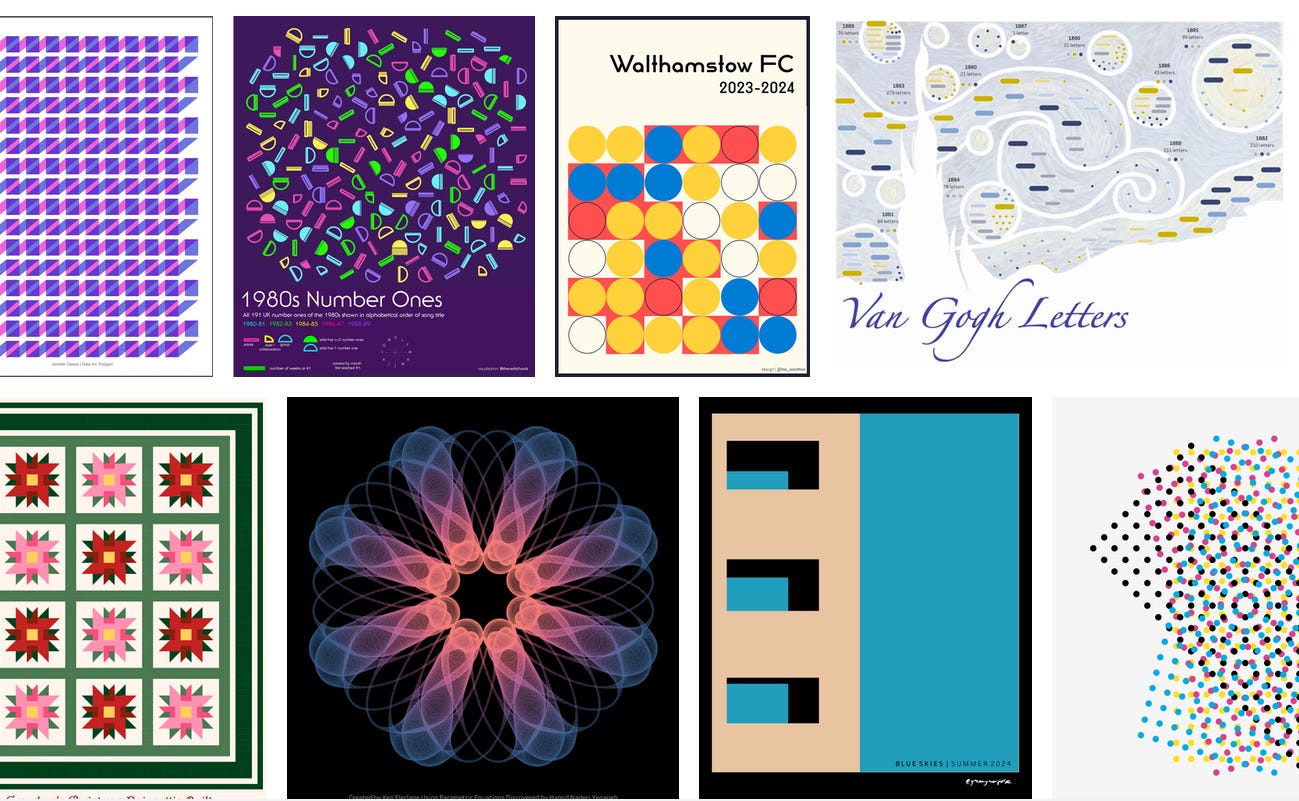
A Collection of Tableau Data Art and More!
Explore stunning data art and creative visualizations here: Link 😍
My projects
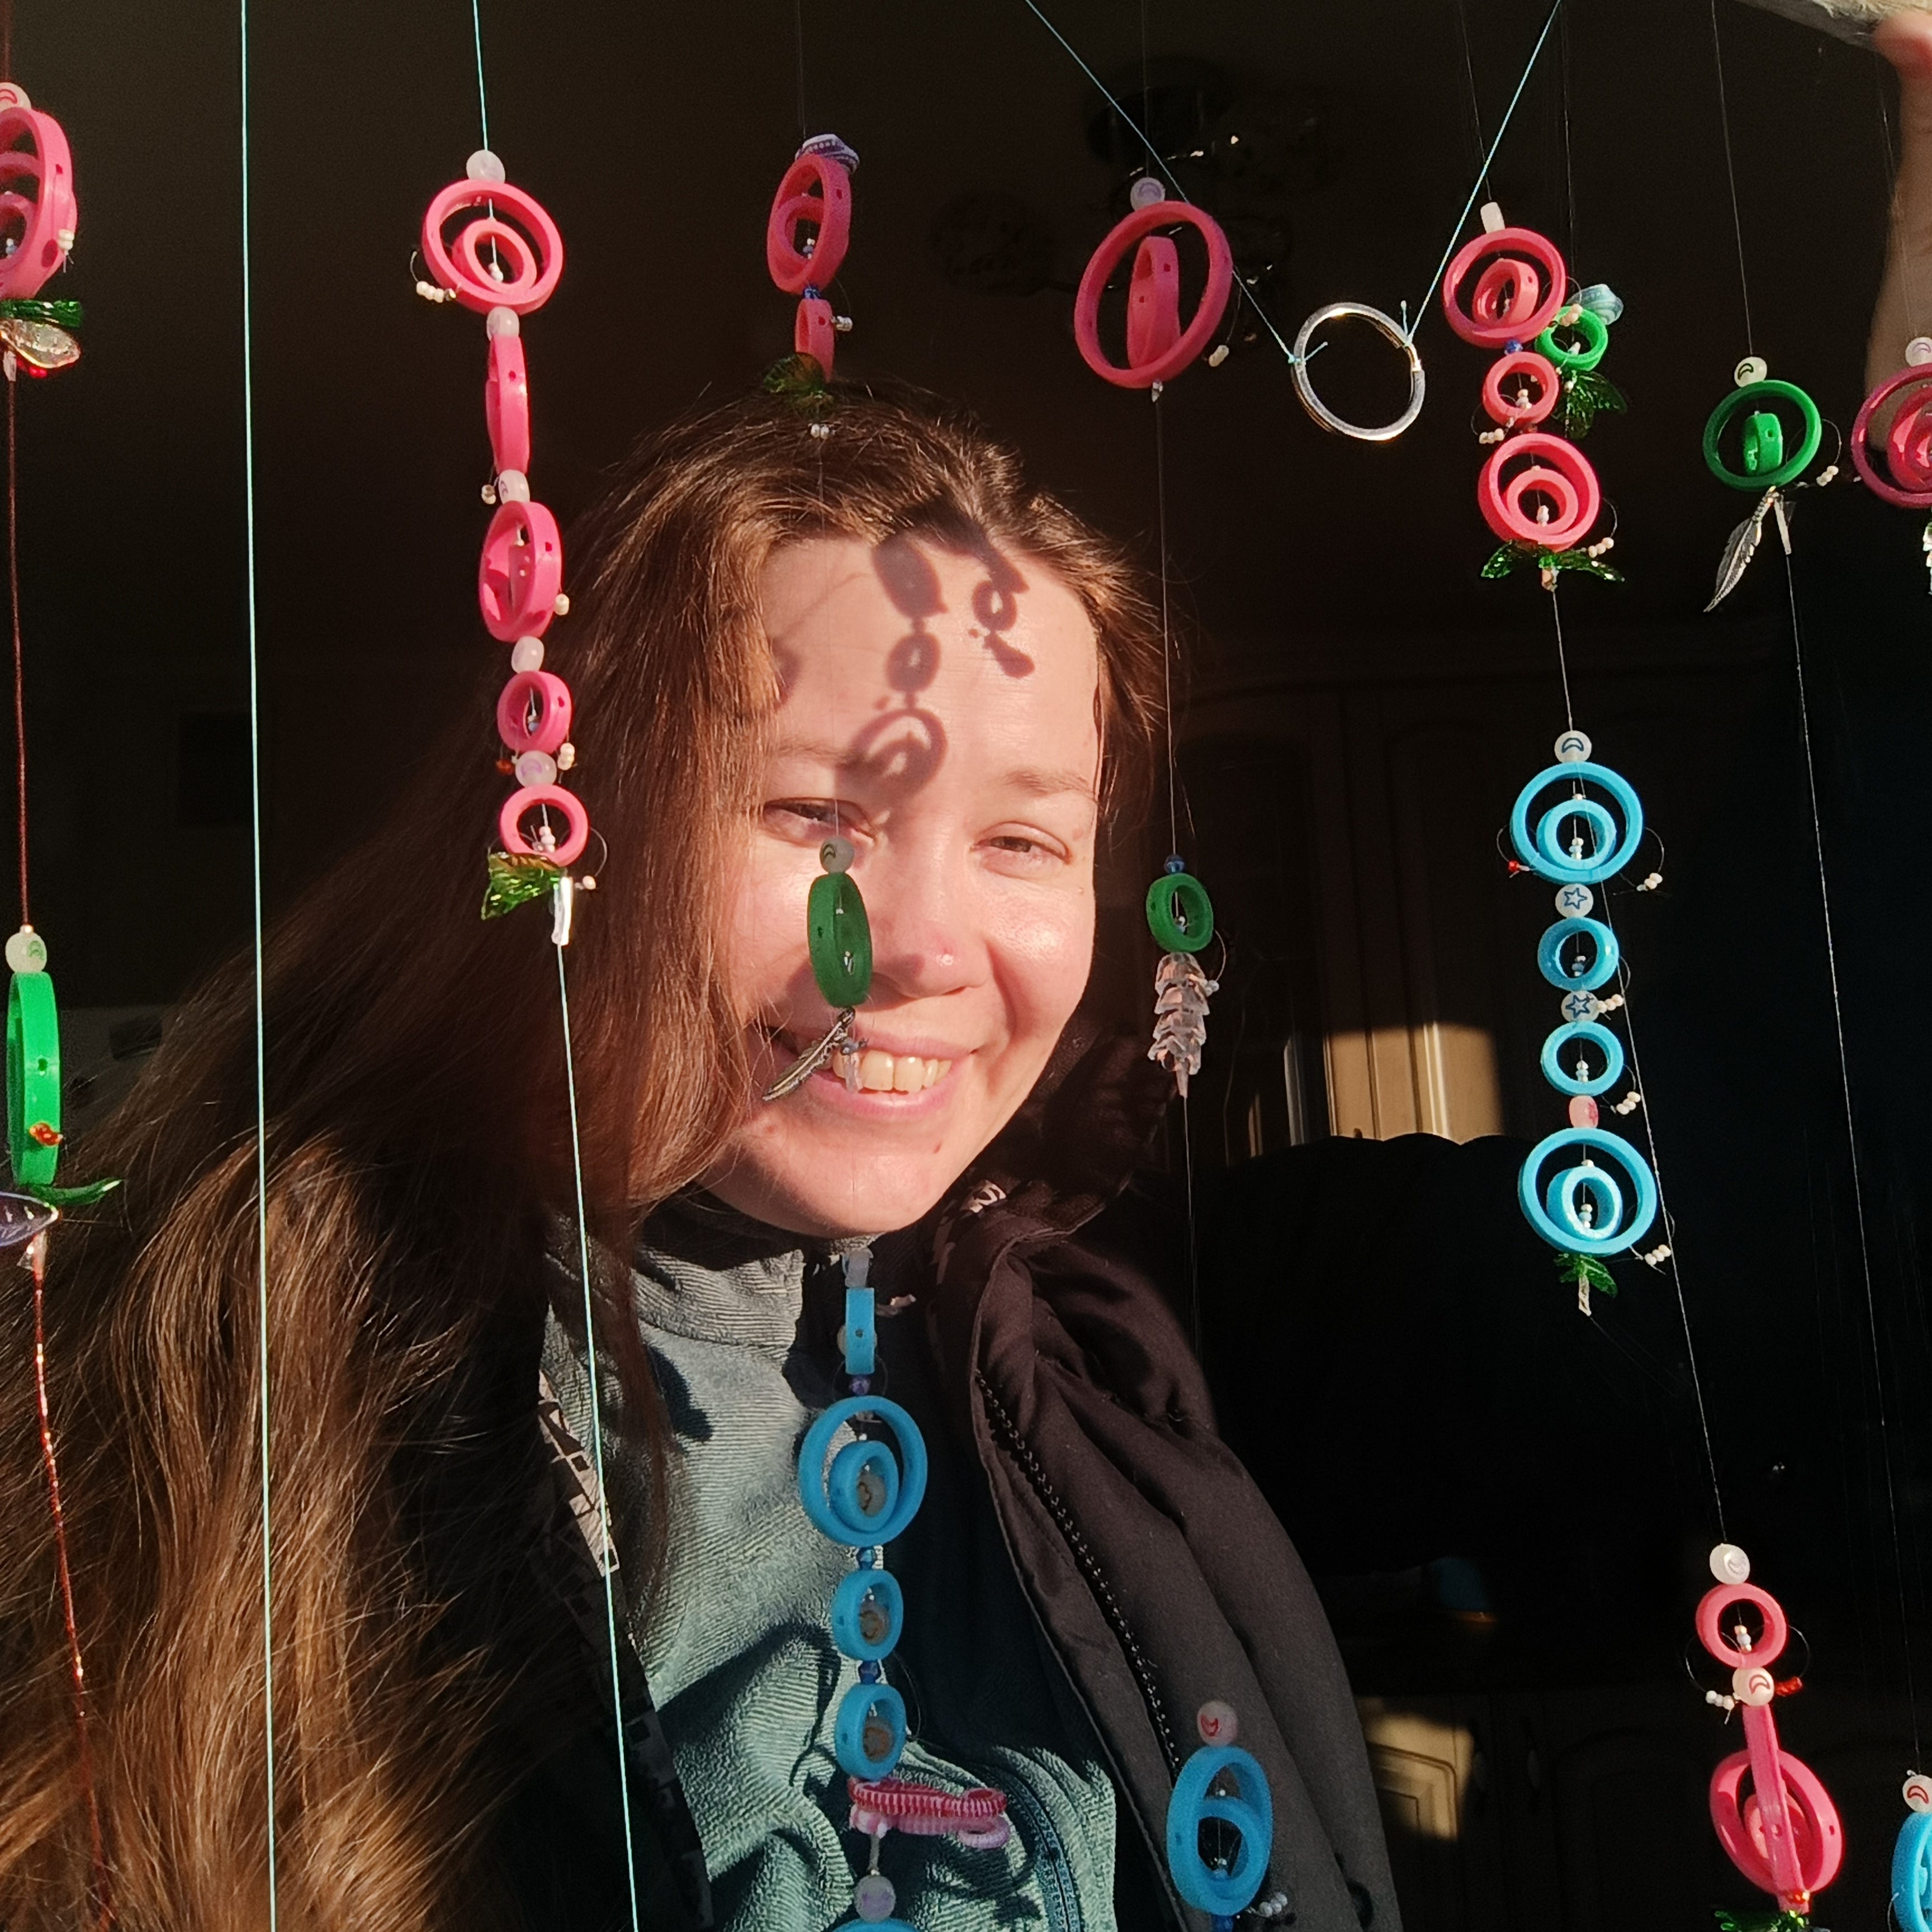
Traveling with the Wind! 🌍✨
Hooray! I’ve finally finished my long-term (almost a year!) physical data art project about travel!
It was both challenging and fascinating. I collected data from my travels over the past 10 years long ago and even created a hand-drawn project with markers.
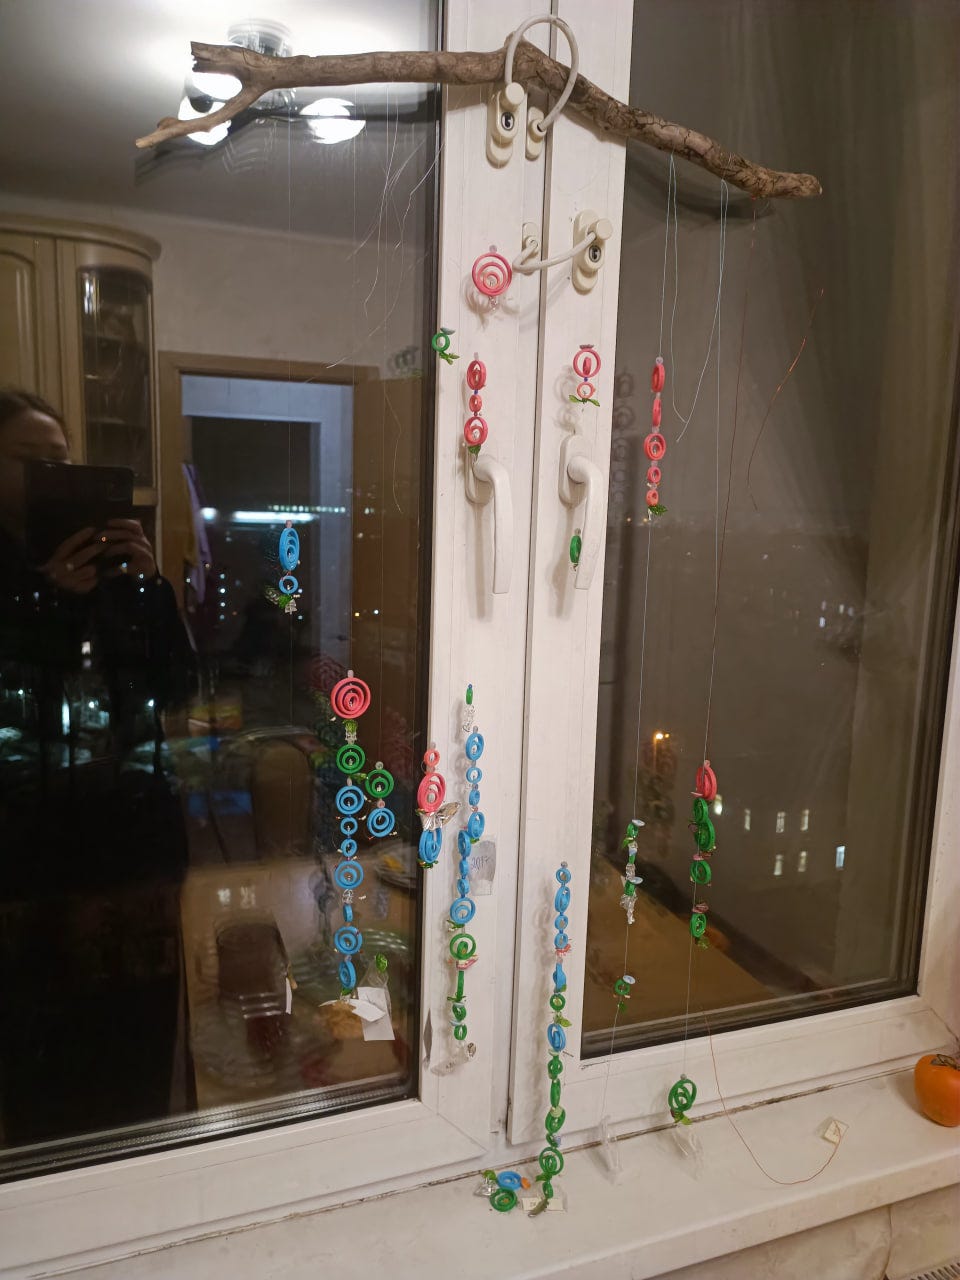
But I wanted to turn it into something tangible, something more impactful. 😎✨👌
After much effort, beads, sequins, colorful 3D-printed rings, epoxy resin, beautiful branches, and endless adjustments…
Look at what came out of it! 😍
More details on the project website: Link
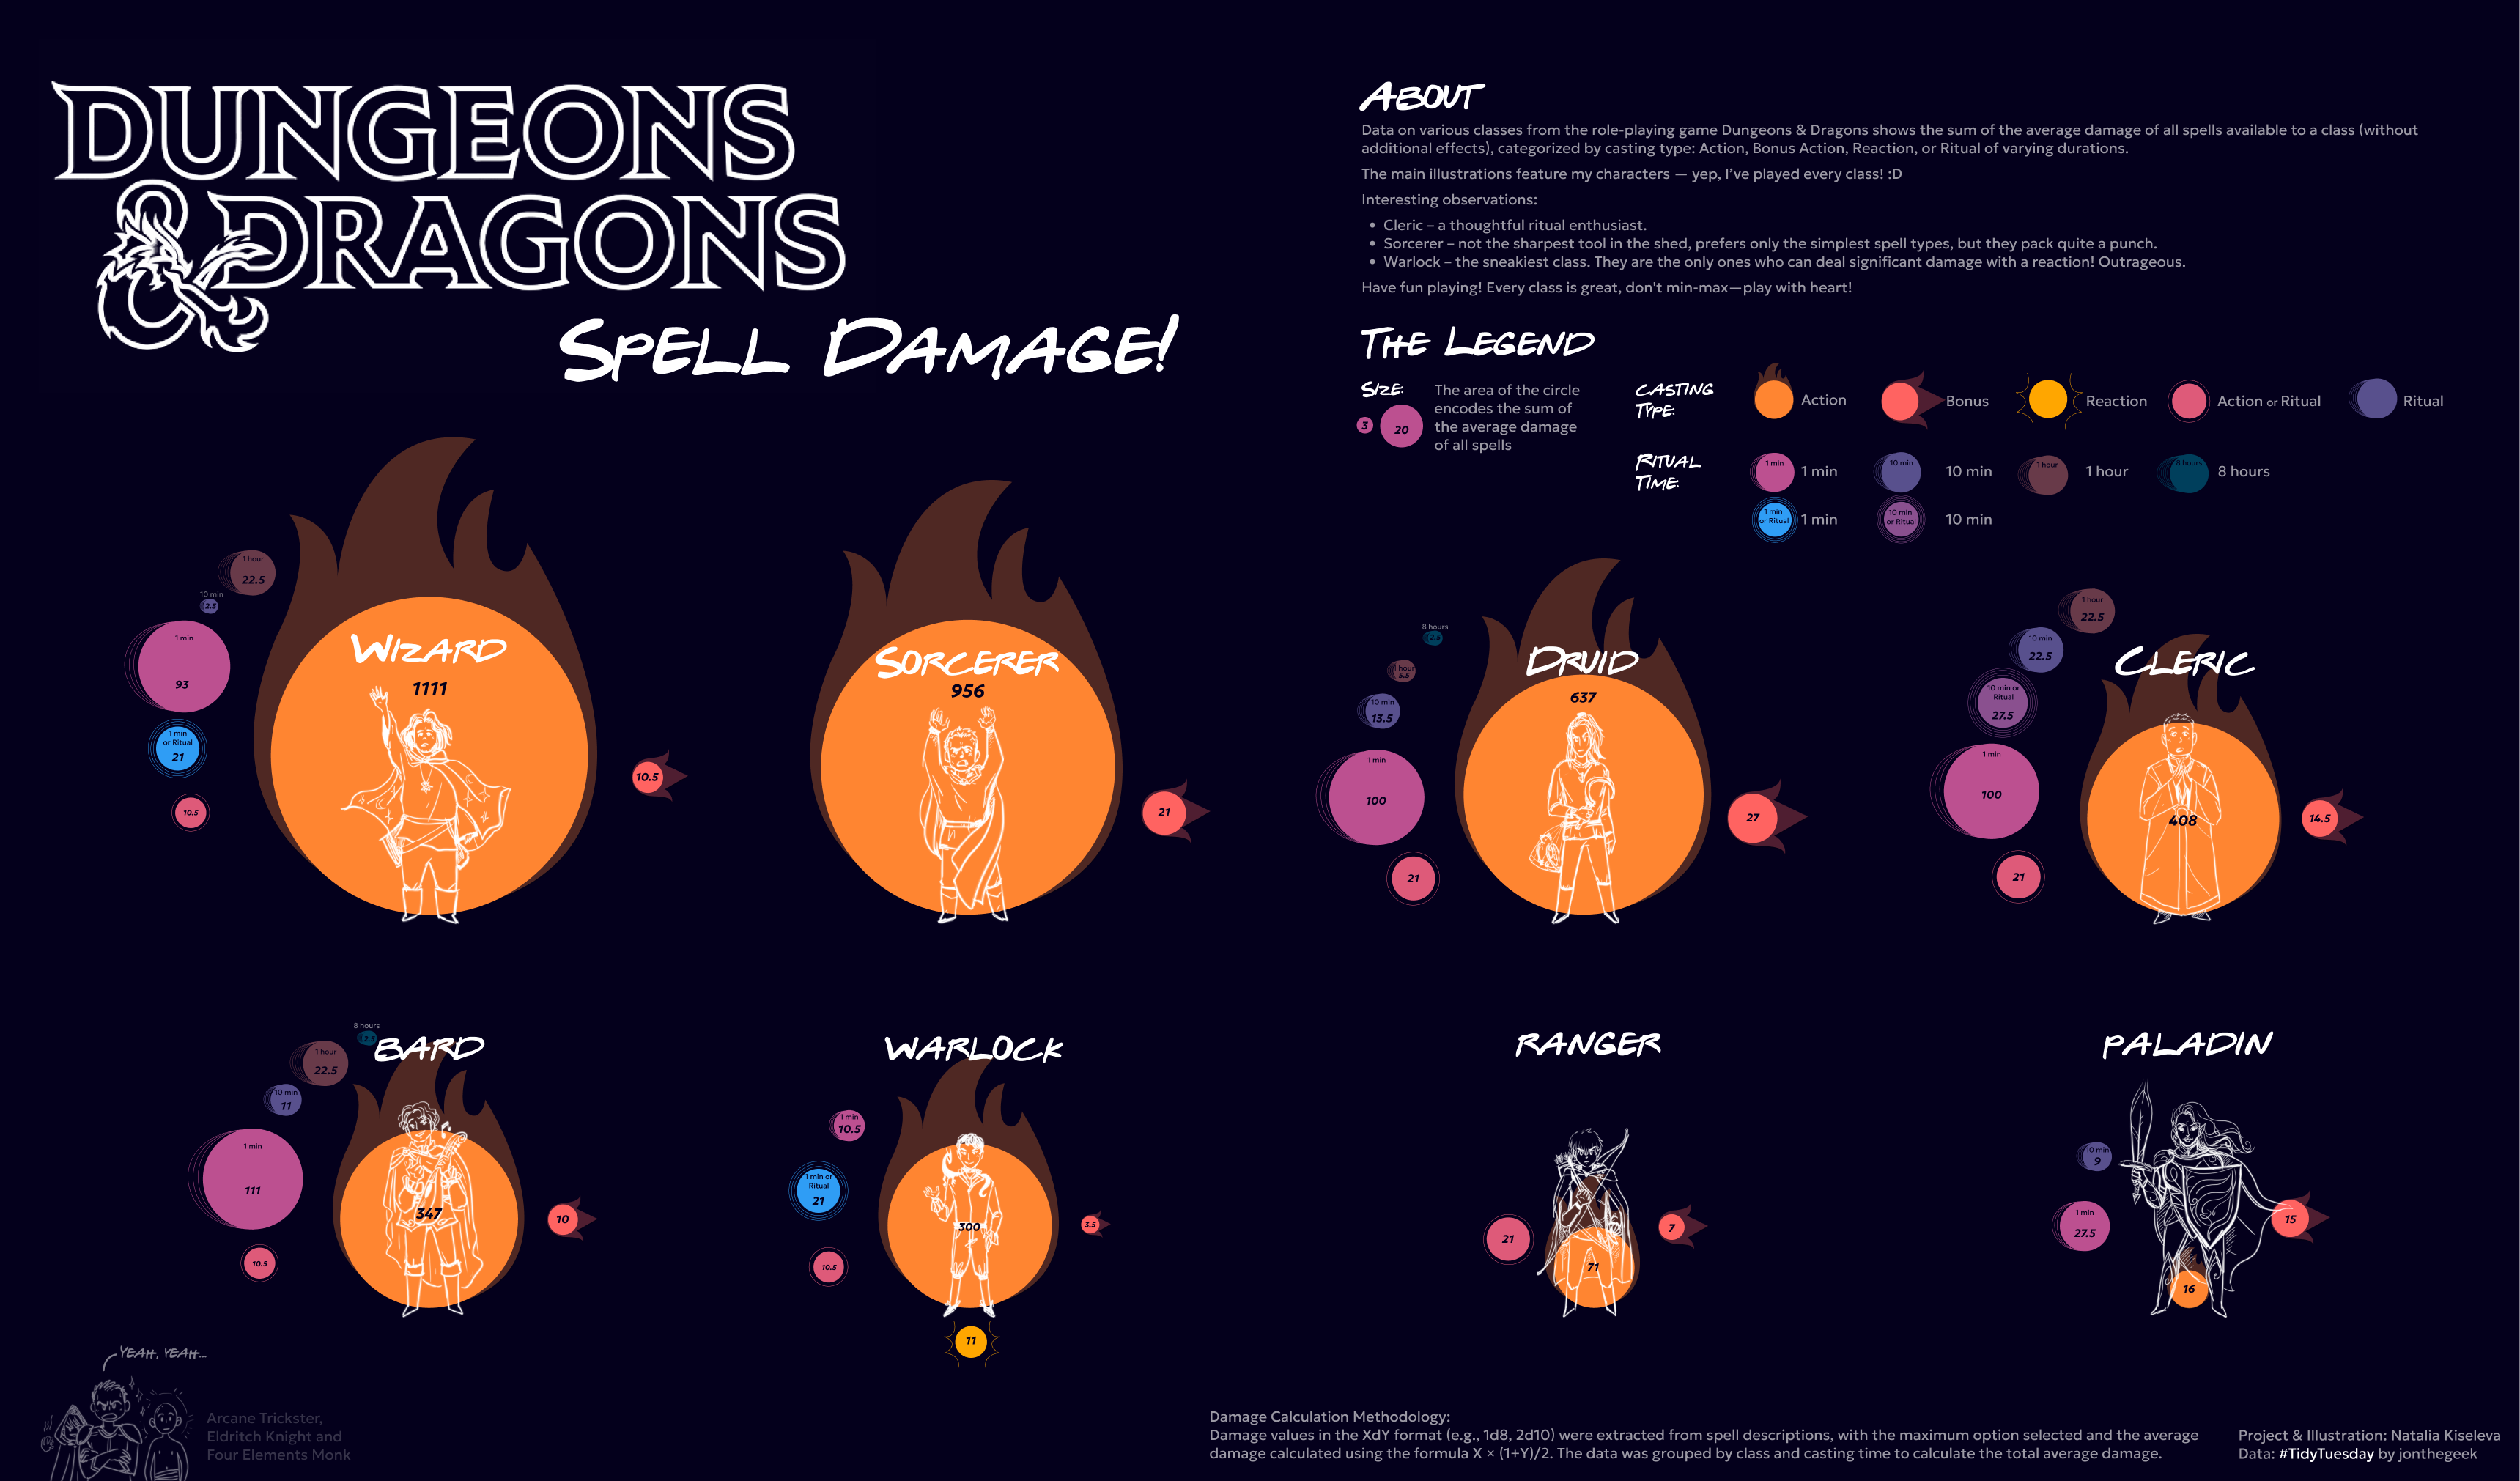
Dungeons & Dragons Spell Damage!
DnD Spell Damage Project! 🎲✨
Analyzed average spell damage by class and casting type using a DnD dataset for #TidyTuesday.
Key insights and methodology are on the poster. Fun findings are highlighted at the top.
I’ve played all these classes, so I drew my own characters instead of generic art—hence the gender bias. 😄
Do you play? What’s your favorite class? 😎
Mentorship Achievement in DVS! 🎓✨
I’ve mentored three cohorts now, and it’s so rewarding to see my mentees succeed in the international data visualization field! 🥰
This year, I had a very promising mentee who’s passionate about creative projects and building dashboards in Power BI. 😍
If he shares his mentorship projects, I’ll definitely share them here too! 🥰
That’s it for today! Thank you for reading!
You can support our community with a donation or treat the author to a coffee at the link down here: