

My Tips for Advancing in Dataviz!
Also Data Bunnies, Data Art Knowledge Base, the Podcast and Northern Travels!

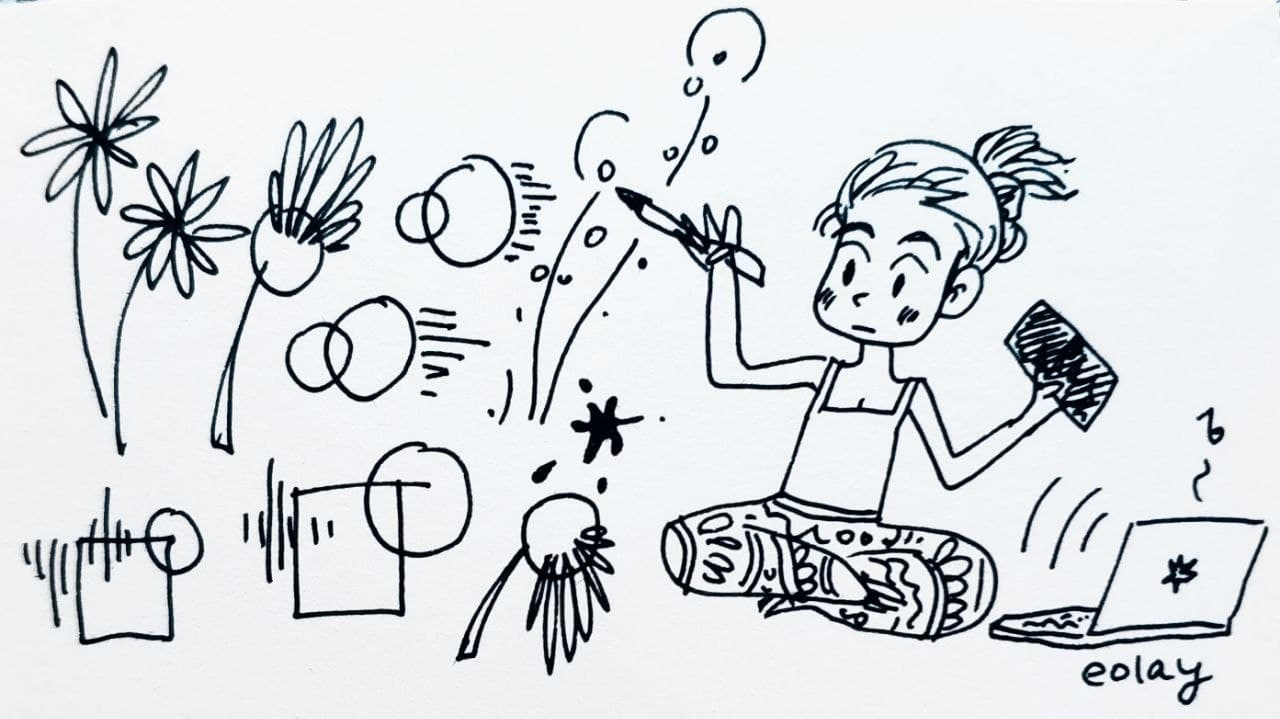
My tips for advancing in data visualization:
Below in the text, you will find links to the podcast with Hana, where I talk about my journey in data visualization and data art and give advice on how to combine data art with other activities (work and raising a child, for example)!
Here is a brief summary of these tips!
Use free and simple tools
Use the energy of your emotions to finish projects
God bless pre-made color palettes
Work on projects while your child is sleeping or playing nearby... (when else??)
Start with small, quick projects
Copy until you get it right
Find comrades and share!
Find your superpower
Have fun!
Flowers & Numbers - News!
New Data Badges On the Street!
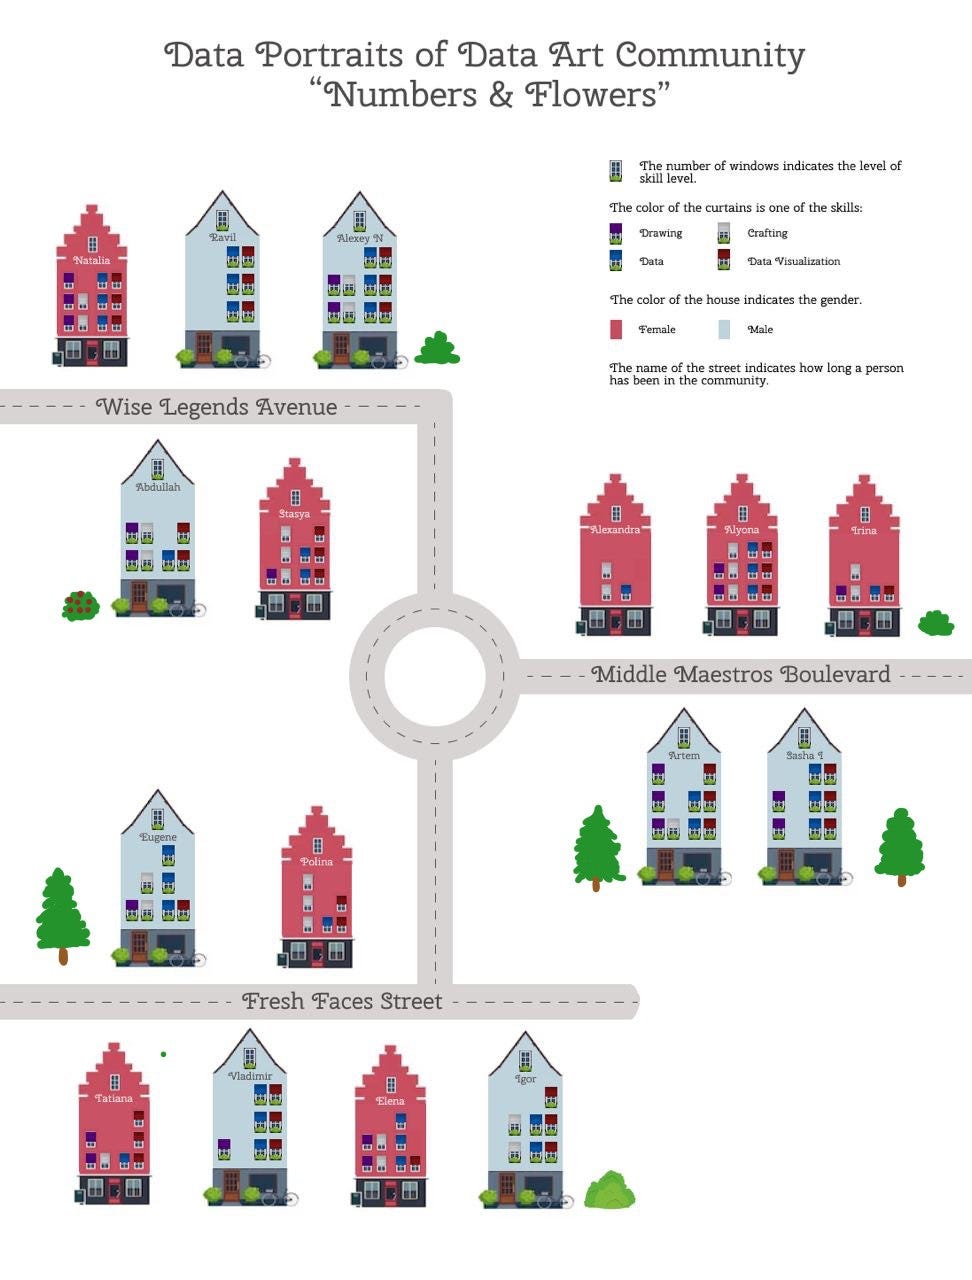
We discussed the new community badges on the last broadcast, but I can't help but post them separately! Alyona Kotovich depicted the community members in the form of houses, she also guessed to enrich the data set by bringing participants to the group, creating a kind of "streets".
The project was done manually, so not all the participants are here - we can hardly put all of them in the portrait of the community.
Data Bunnies!
How can anyone resist encoding information with bunnies? 😁
One of my first data art projects was about bunnies, so I decided to dedicate some time to traditional techniques and drew this little team.

The badges for the Flowers and Numbers community are in the form of bunnies. The data remains the same. Here, we show the level of proficiency in various skills among community members (from the initial questionnaire).
You can view these and other badges on the community website!
World Data Art News
Data Art Knowledge Base!
For the Flowers and Numbers community, I’ve gathered all the basic materials on data art in one place to ensure nothing gets lost in our large Telegram chat, making it easier for newcomers to dive into the world of data art!
Since I’ve put this together, I won’t keep it to myself - I’m sharing this wonderful data art collection with everyone! Here you’ll find articles, books, and videos in both Russian and English! If you have any links on the topic (as this is not exhaustive!), please share! I hope this knowledge base will continue to grow!
One day, I’ll also share my collection of data art from around the world! But for now, it’s on hold - it’s too good to keep gathering dust, I should share it with the world!
Learn more about data art from the Data Art Knowledge Base!
Recording of the Outlier 2024 Conference!
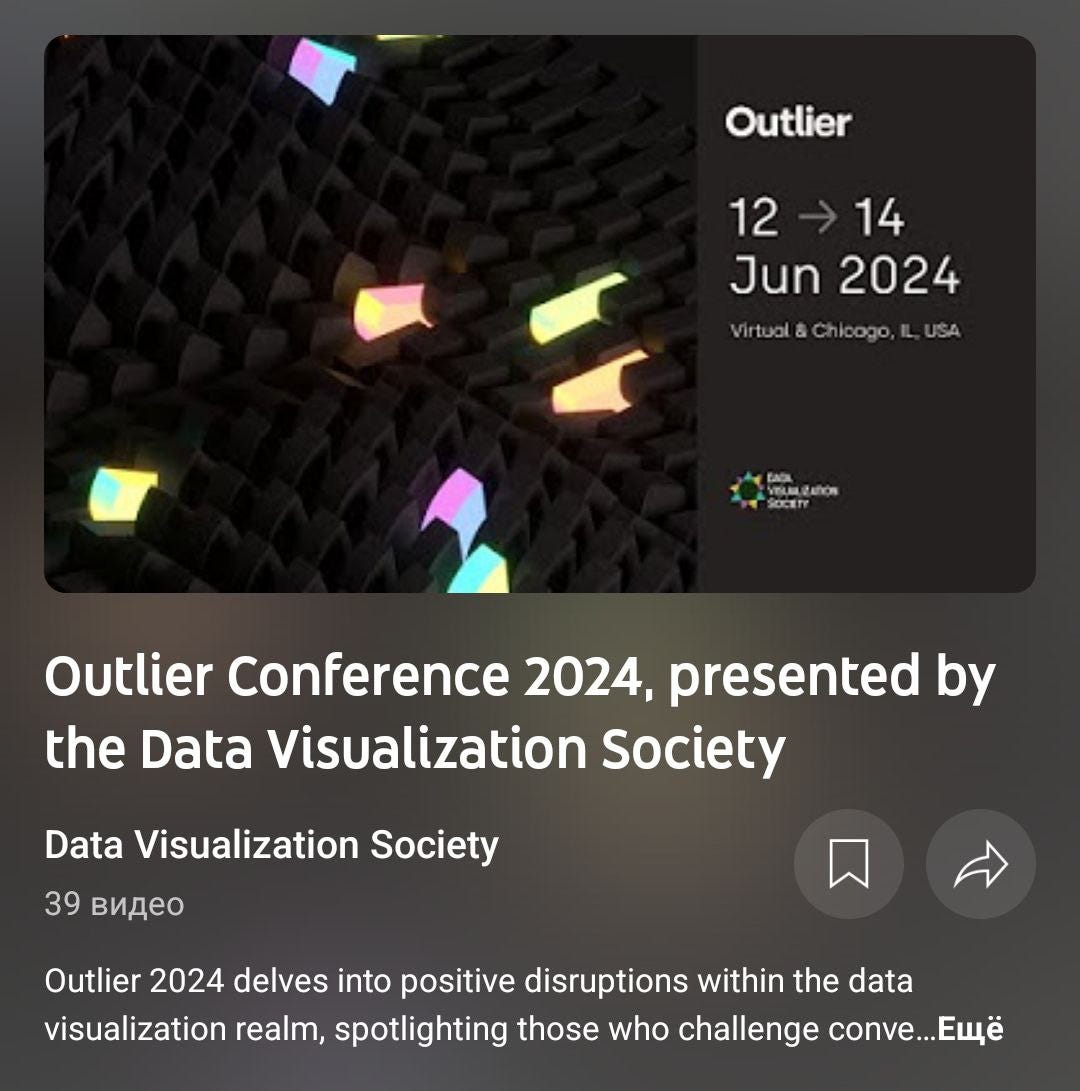
The Data Visualization Society has uploaded the recording of the Outlier conference on YouTube. Oh, so many pleasant faces and familiar names!
Nick Desbarats, Sophie Sparkes, Valentina D'Efilippo, Eli Holder, Kenneth Field, Leticia Pozza!.. I’m sure other speakers had interesting talks too!
There are so many presentations that I haven't even finished watching the last Outlier!
Data Bracelets From The Summer School!

Nadya Andrianova has been at the Summer School near Dubna for a week now as an organizer and a data journalism workshop instructor. With colleagues - Anastasia Maryasova and Marina, they conducted a workshop where participants created data artifacts as souvenirs.
Participants answered questions about their life at the Summer School and made data bracelets from found materials. The questions were about sleep, food, and the most important aspects of the School. Over 70 participants created personalized bracelets, each with a piece of the Summer School as a keepsake!
The richest 1%

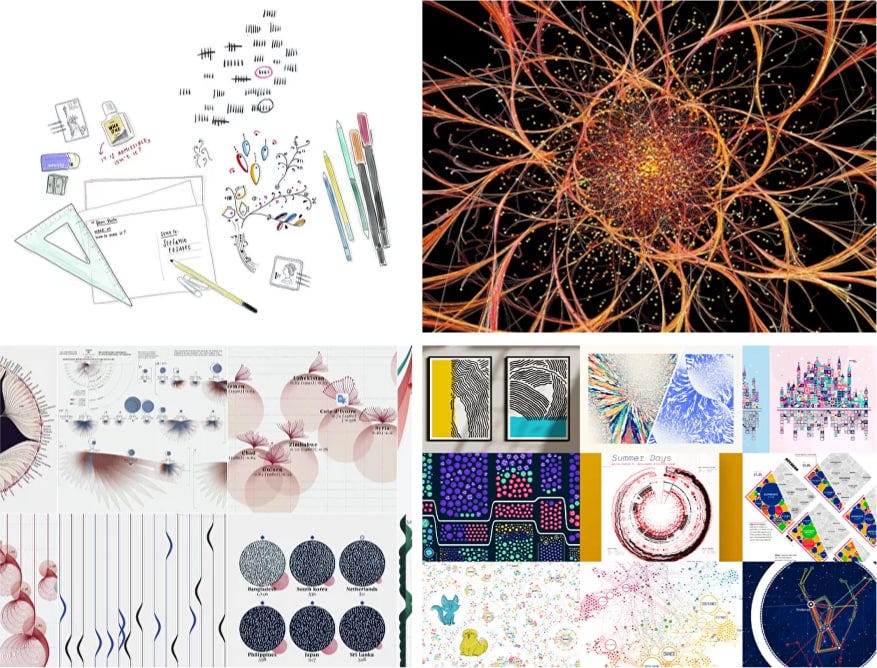
A new project by Federica Fragapane focused on global inequality. Executed in her unique style, resembling shells with hearing loss. Lovely natural forms! You can view the details here!
Visualizing the Digital Nomads

I promote the idea of data portraits in the community because it's awesome! 😄
I'm thrilled to see more global examples emerging! For instance, Victor Muñoz created badges for digital nomads!
By the way, Victor has now joined the data art community "Flowers and Numbers", making it officially international. So, I'm frantically translating materials into English.
You can read Victor's article about his badges here!
Interactive Football Project!
with data art by Edit Gyenge

In essence, these are also data badges, and it seems they are becoming increasingly popular! Check it out on the website!
My projects
My Travels Project
Still in process! Here you can see the current state of it! Oh! I hope I will finish it soon!

In this project, my travels over the past 10 years are encoded. They are grouped by year and season, divided by destination and duration, and include information about transportation methods and my opinion of the trip! Additionally, it shows the company I traveled with and the purpose of the trip!
I can read about the analog part of the project here.
Tips for Advancing in Data Visualization!
I finally received the recording of our video with Hana! I remind you that about a month and a half ago, the wonderful Hana M. K. invited me to participate in her podcast ! 😍
She hosts podcasts with experts in the field of data visualization, learning about their journeys, projects, opinions, and collecting their advice.
She really liked my recommendations for beginners in data art and my journey in the industry in general, so I shared about myself and my projects, especially the traffic accident project.
You can find the show notes on Hana's website: http://trending-analytics.com/podcast
Vacation. The Mezen Style
I’m on vacation, traveling through my hometown! I bought some local folk gingerbread decorated with Mezen-style patterns and I’m thrilled! They remind me of my Mezen family project. I’m really interested in doing more projects on folk art, as I find it incredibly fascinating! Friends are even sharing books on the subject with me, so I hope to continue this project sooner or later. For now, here are some photos of these delightful gingerbread cookies and an installation from the banks of the Northern Dvina!

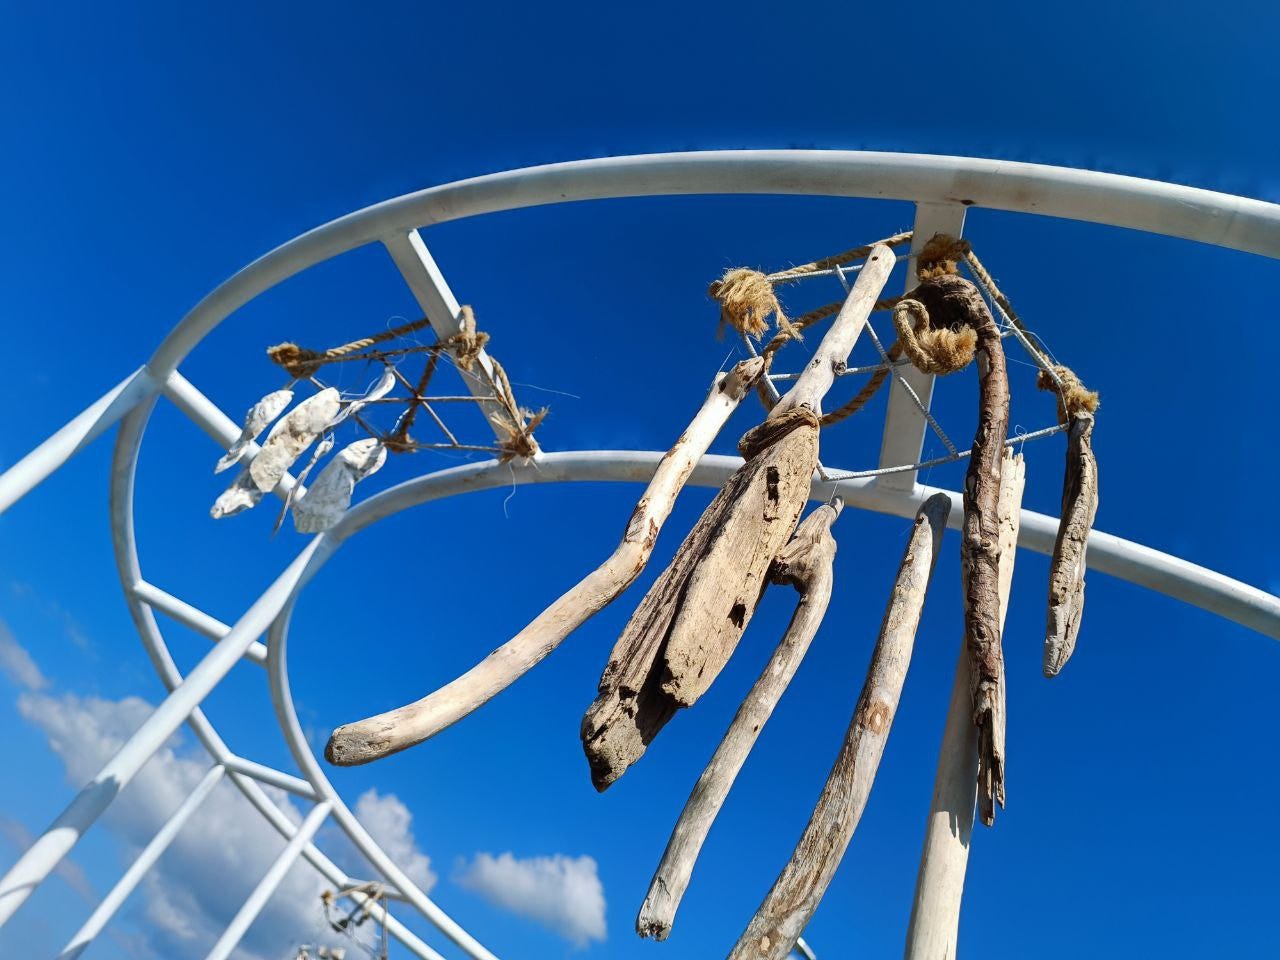
The Bells. Crafts of Pomorye
While I'm on vacation in the Arkhangelsk region, I’m sharing some local beauties with you! On the embankment, besides the charming set of Wondersmiths, the window to the Arctic, and more, you can find an installation dedicated to local crafts.
It’s called the Bells. Four groups: wood, bone, shells, and stones. It makes a charming clinking sound. And against the blue sky, it's simply enchanting...
That’s it for today! Thank you for reading! 🌸
You can support our community with a donation or treat the author to a coffee at the link down here:
Great round up! I really love the Data Art Knowledge Base you've put together. Thank you so much for translating it into English 🙏