How to find inspiration for new data-driven creations?
Handmade data art, intricate networks, stunning flowers, and beads!
How do you find inspiration for new data-driven creations?
Choose a topic that resonates with you—something you cherish or are deeply interested in.
Gather data on your chosen topic. You can collect it manually, selecting a few key categories and variables. Keep it simple—focus on what you understand about your subject.
Think about a craft that brings you joy and where you feel confident. Drawing? Collage? Weaving? Beading, candle-making, soap-making? Sewing or knitting?
Consider how to tell your story using your skill. Could it be knitted graphs or woven pie charts? Or perhaps flowers or trees encoding your data?
Start with simple sketches, then refine and complete your piece—after all, it’s something you love and enjoy doing!
And when you're done, tell me all about your project! 😊
Flowers & Numbers - News!
Festive Data Badges!
Here's a takeaway from Sophie (
): A fun extra at her end-of-term project showcase, Sophie Sparkes designed fun and festive data badges for attendees to colour and press in a badge machine. This is a perfect activity to jazz up your next data event or team meeting.I love the project! It’s so cute!
I really love hand-drawn data projects, and Sophie shares my preferences here! In my opinion, nothing is more charming than careful hand-drawn illustrations. They always enrich any data project. Though it’s not easy to find someone who can both draw and work with data. Appreciate us wonderful people!
Also you could watch our with Sophie videostream about illustrations in data art here:
World in Tangible Fragments
Nadya Andrianova has finally created a website for her wonderful project inspired by the #30daychartchallenge! It features several charming pieces—physical data art embedding various datasets. Be sure to check out this beauty!
I especially love the beaded project—the earrings! But the rest are magnificent too! Ah, those colors—the combinations of blue, beige, and gold are simply stunning!
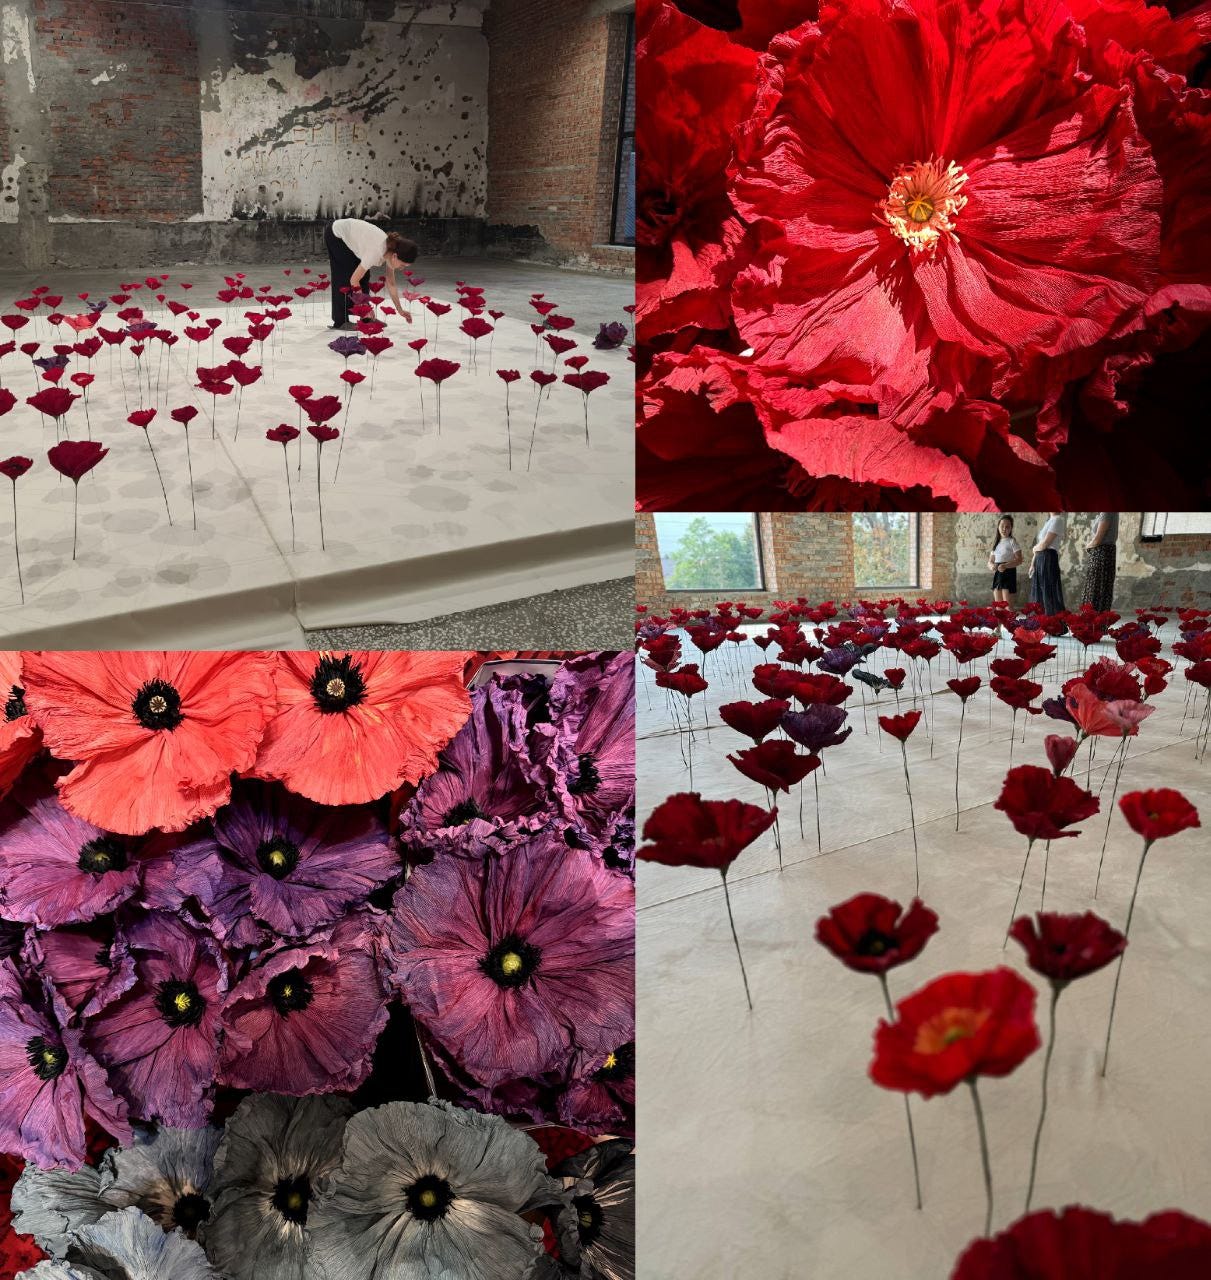
Flowers of Beslan
Nina Lindell’s incredible project now has its own website, where you can explore it in detail, watch videos, and read about the creation process.
This deeply moving and beautiful project is dedicated to the Beslan tragedy, representing the victims as delicate paper flowers, handcrafted by compassionate people.
💔💔💔
World Data Art News
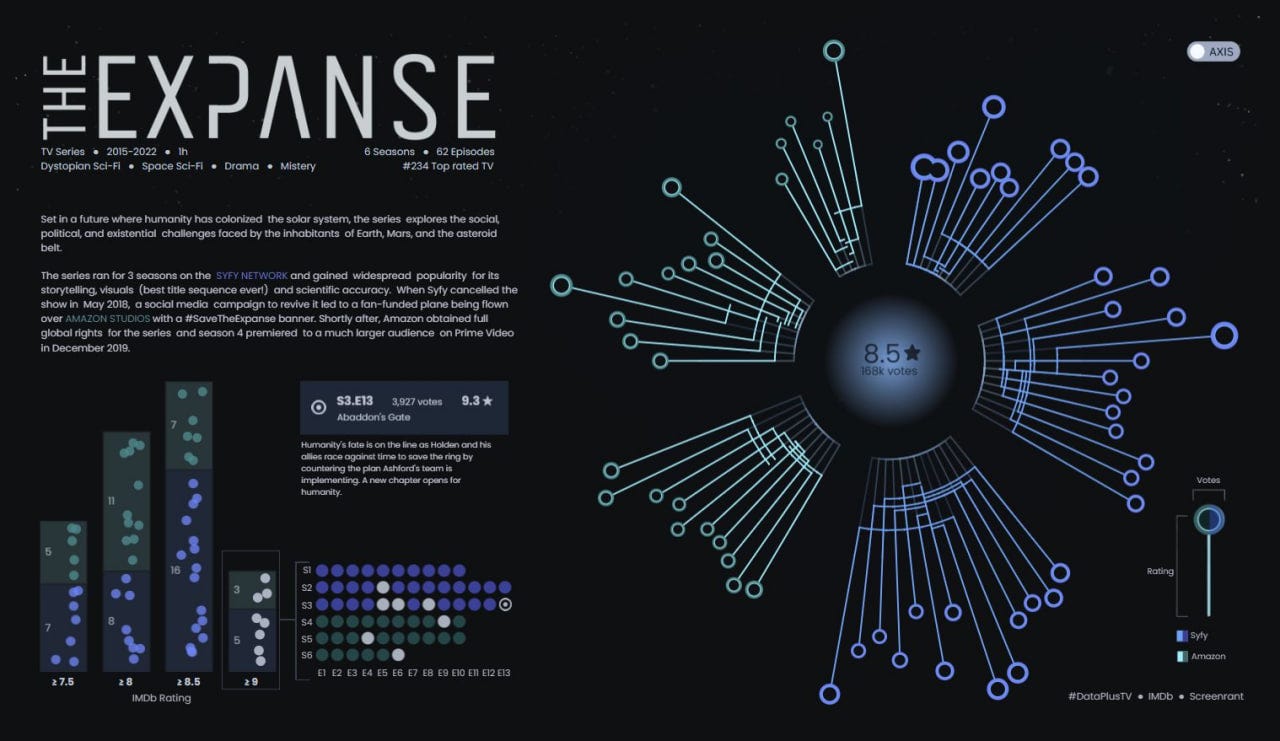
The Expanse
A Tableau project by Andreea Scintei dedicated to The Expanse series. Turned out pretty interesting! 🙂 I like the color palette and the restrained, mysterious style.
The Sky As a Canvas
The SCMP beautiful piece features a lovely data art illustration, among other things.
The infographic visualizes solar activity over nearly 200 years. The time series follows a spiral, with the color and size of the bars representing the annual average number of sunspots.
A Creative Project on Van Gogh’s “Sunflowers” 🌻
My dear student Tatiana Popova created a data project dedicated to Van Gogh’s Sunflowers—both the paintings and the flowers themselves.

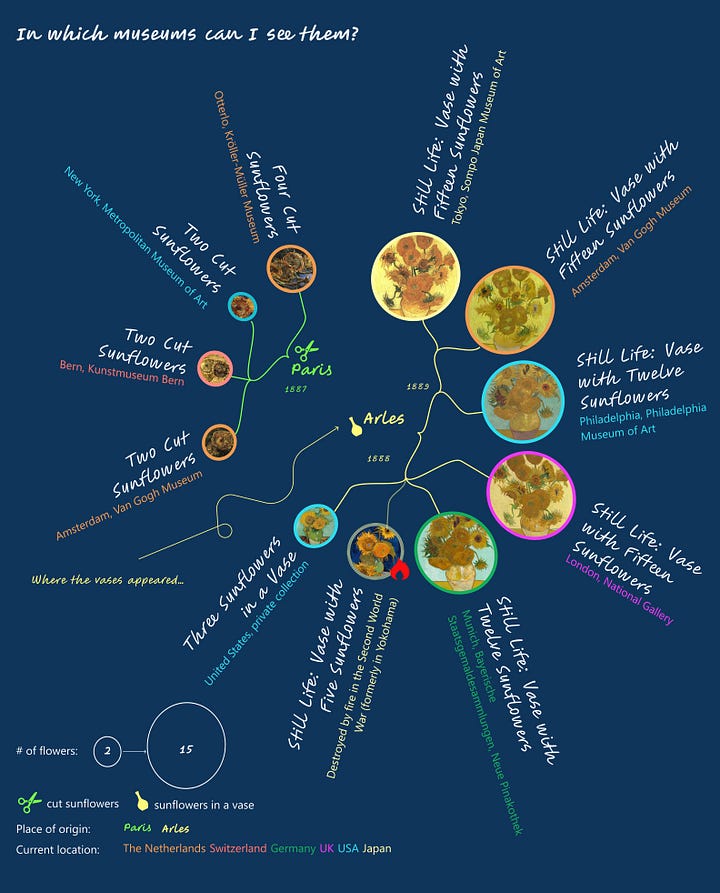

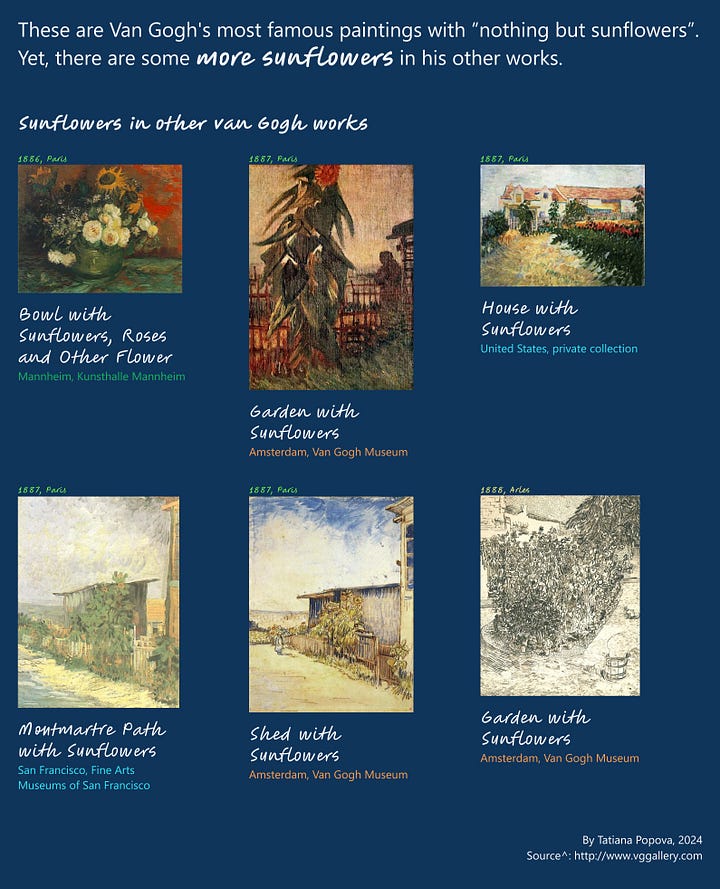
She explored how many versions of the artwork exist, where they were painted, and where they are now. Then, she counted the number of flowers in each painting and analyzed changes in the color palette using Adobe Color. In the final version, she also included paintings where sunflowers are present but not the main subject.
The project was created using RAWGraphs and Figma. It went through several iterations, with feedback helping to refine the final result. The outcome is vibrant, rich, and truly inspiring!
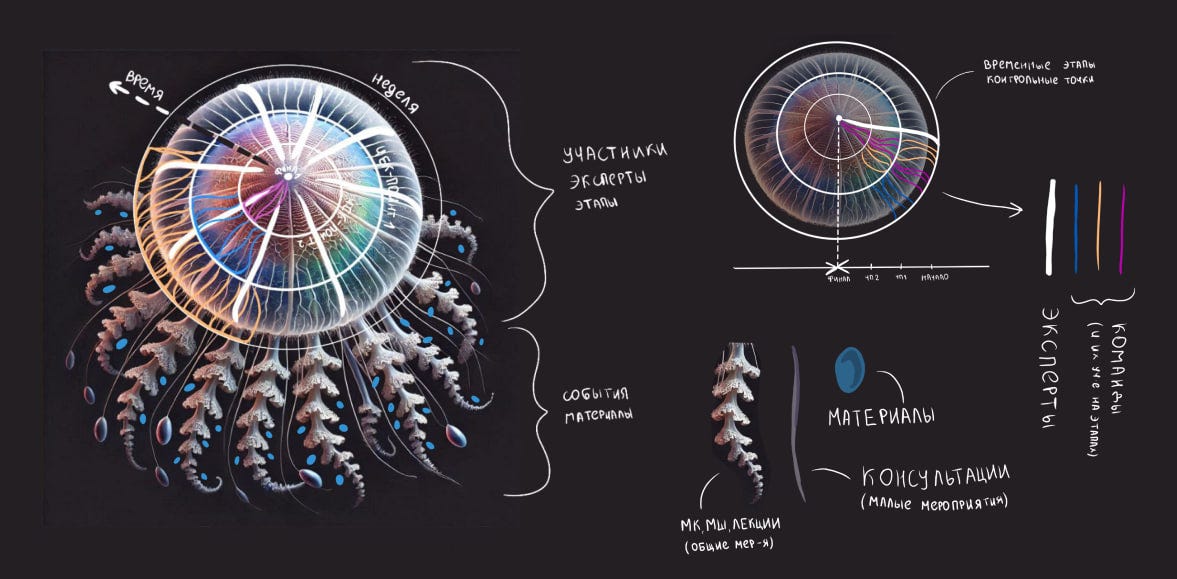
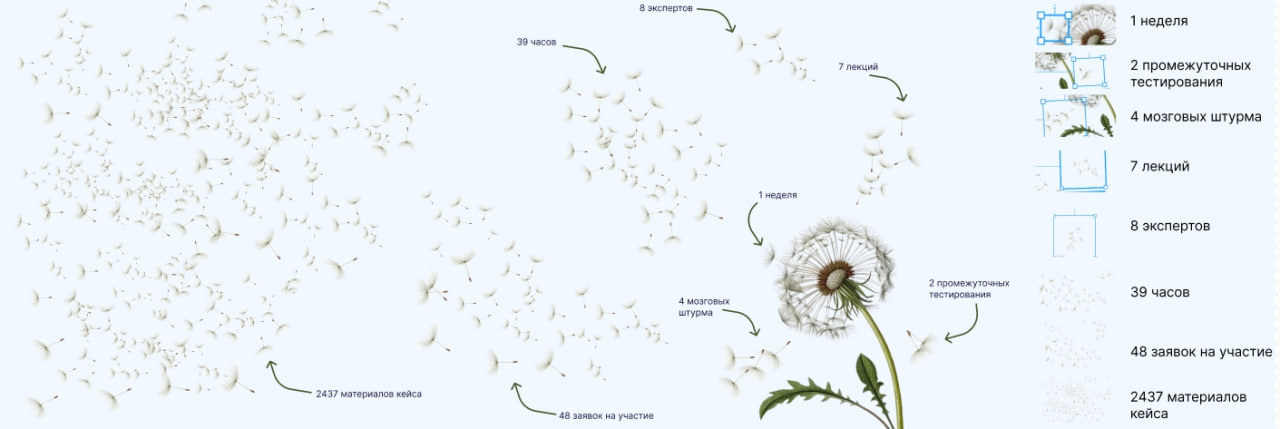
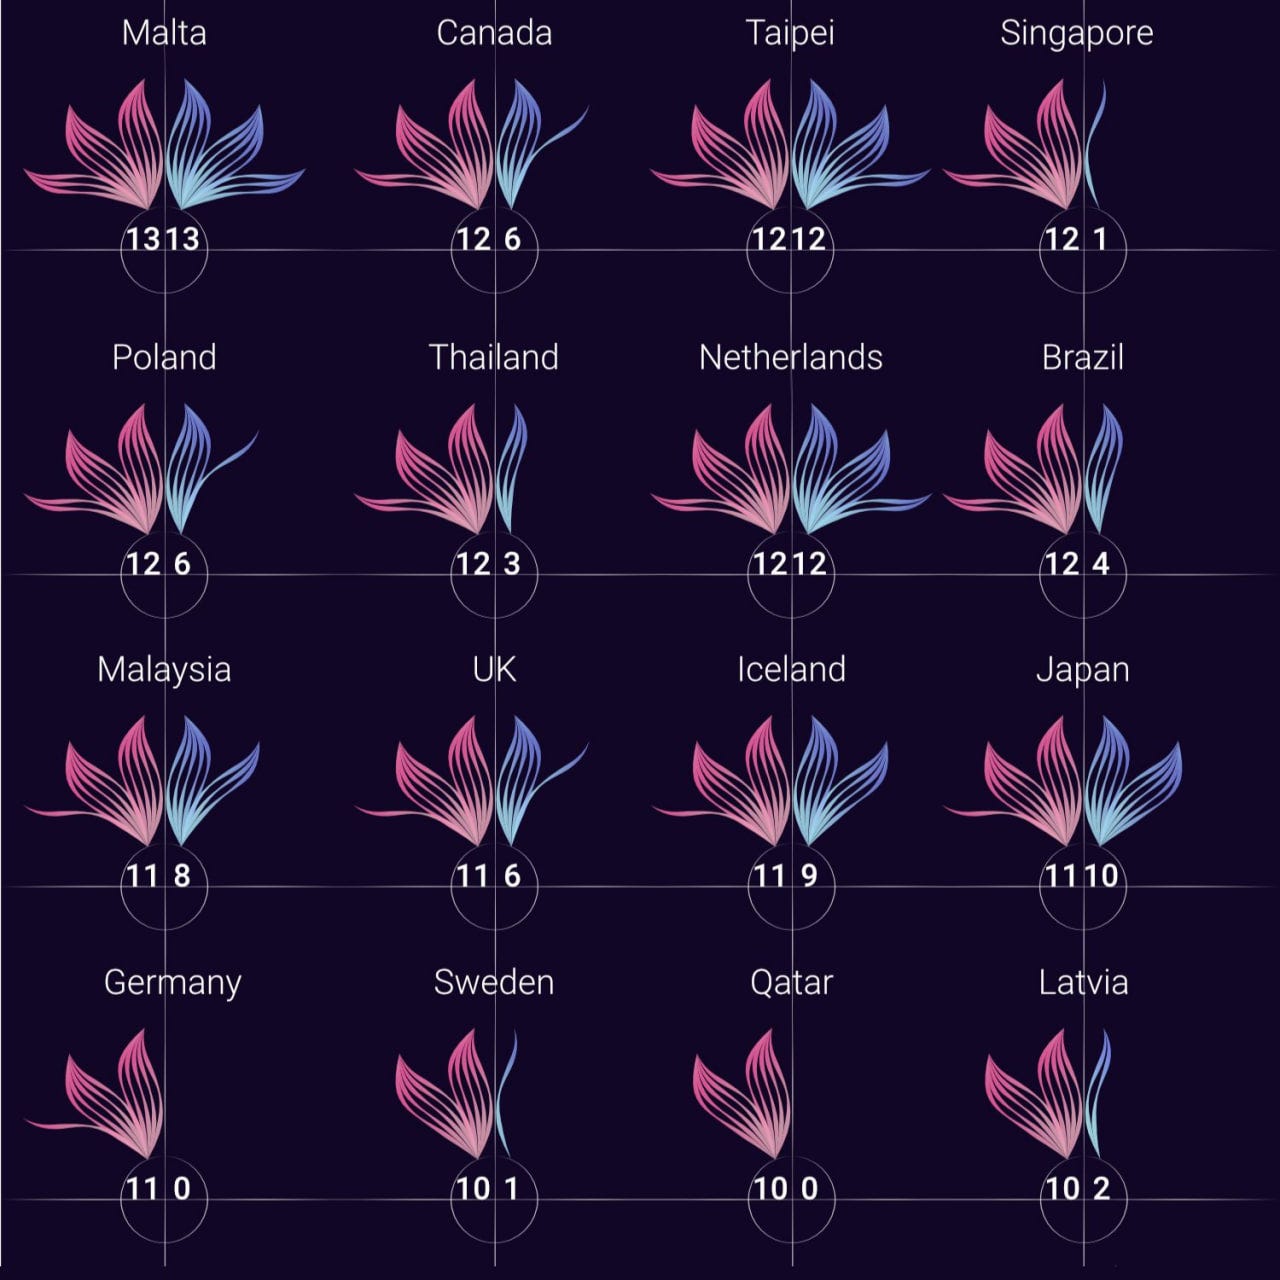
Nature-Inspired Data Art from ITMO!
I just found out that ITMO students are now creating data art in their lab projects—how wonderful! 😍
Just look at these stunning jellyfish! Other nature-inspired themes are just as intriguing. I'm so happy to see data art becoming more common in student projects!
Here are a few examples (though I can’t share the authors’ names). Hopefully, these works will be officially published somewhere soon!
A tool for creating creative visualizations.
The gallery on ladataviz—by Tristan Guillevin—features many creative and complex visualizations made by different authors using Tristan’s tool.
Including some truly artistic ones! 🥰
A Stunning Project by Refik Anadol Studio & Danil Krivoruchko
An incredible 220-square-meter data installation for Akbank, created by Refik Anadol Studio and Danil Krivoruchko.
Danil shares an interesting detail about the project:
“One of the key steps was data preprocessing. A multi-megabyte table with transaction data—dozens of columns and tens of thousands of rows—was segmented and compressed using the UMAP ML algorithm, reducing it to six dimensions (coordinates and color). This became the starting point for the simulations.”
Studio: Refik Anadol Studio
Design / 3D: Danil Krivoruchko
Project: Akbank x Refik Anadol
Visualizing the Sound of Bells
Darya Yusova analyzed the melodies of different bell towers, breaking down their sounds by tone using spectrograms.
The goal is to showcase the grandeur of Russia’s unique, multi-layered bell-ringing tradition, dating back to the 16th century, and let viewers "see" the sound through visual representation in a book.
Fear of Failure
A wonderful project by Edit Gyenge on the fear of failure! Check out the article and all the stunning visuals here:
Fear of Failure in Romanian Entrepreneurship
Databeads project
Check, how the the Eszter Katona & Mihály Minkó duo creates data-driven beaded bracelets: Project link!
I love that they provide a materials list and an example of how to recreate the pattern in Excel! I have a similar project: Climate bracelet! And they have the same idea! I absolutely need to discuss with them the struggles of choosing bead colors for Warming Stripes! It was such a pain for me back in the day!
I love the bead projects - theay are always so cute! ❤️
That’s it for today! Thank you for reading!
You can support our community with a donation or treat the author to a coffee at the link down here:







Such a treat to read your newsletters! Always packed with great inspiration ☺️
And thank you so much for featuring my festive data badges!