Examples of Data Art in Tableau!
Plus Mail Adventures, New Badges, Articles, Videos, and Beautiful Palettes!

I never tire of repeating that data art is a very democratic field. You can create projects based on data without having any specific skills, or even better, by applying the skills you already have. In previous letters, I have already mentioned that people come to data art from very different fields.
Here is one example for you: data visualization, the Business Intelligence field, and the Tableau tool. Unlike other BI packages, Tableau is very flexible and has a magnificent public gallery of projects. This is why a large number of data art projects are made in this BI package.
Data art projects created in Tableau. Part 1
Let me mention these wonderful projects, although this is just a part of the data art projects in Tableau that I've come across. If you're interested, I'll share more!
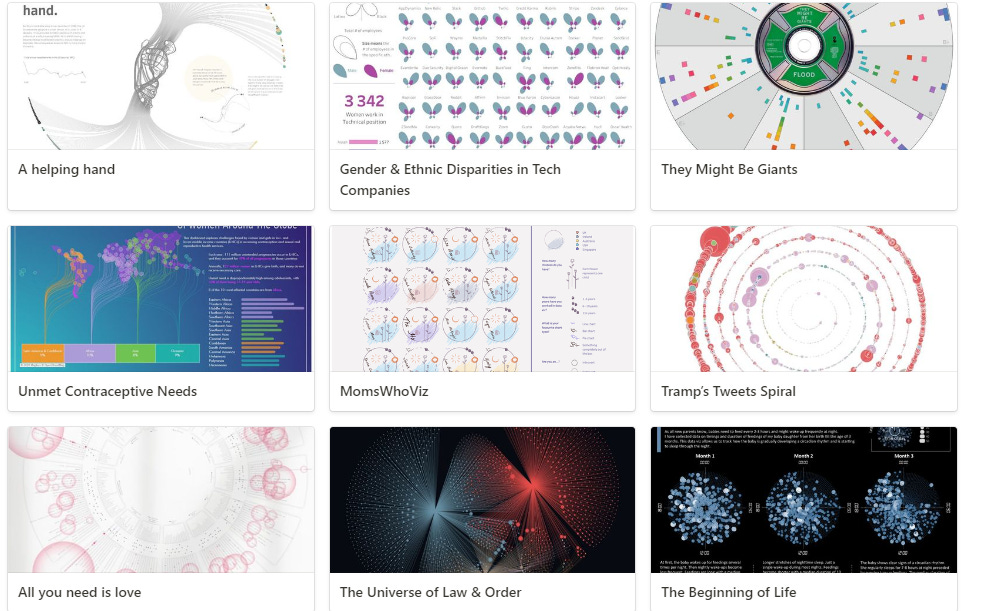
A Helping Hand by Mariona Banyeres
Gender & Ethnic Disparities in Tech Companies by Kovács Ivett
They Might Be Giants by Neil Richards
Unmet Contraceptive Needs by Anshu Saket
MomsWhoViz by Kimly Scott
Tramp’s Tweets Spiral by Neil Richards
All You Need Is Love by Robert Janezic made partly in Tableau
The Universe of Law & Order by Ken Flerlage
The Beginning of Life by Eleonora Nazander
TBC
Flowers & Numbers - News!
I’m excited to share that one of our community members - Anna Ivashechkina - wrote an article about her project for the wonderful Nightingale magazine, featuring her amazing knitting project where data is encoded in soccer player dolls! We need more articles like this!

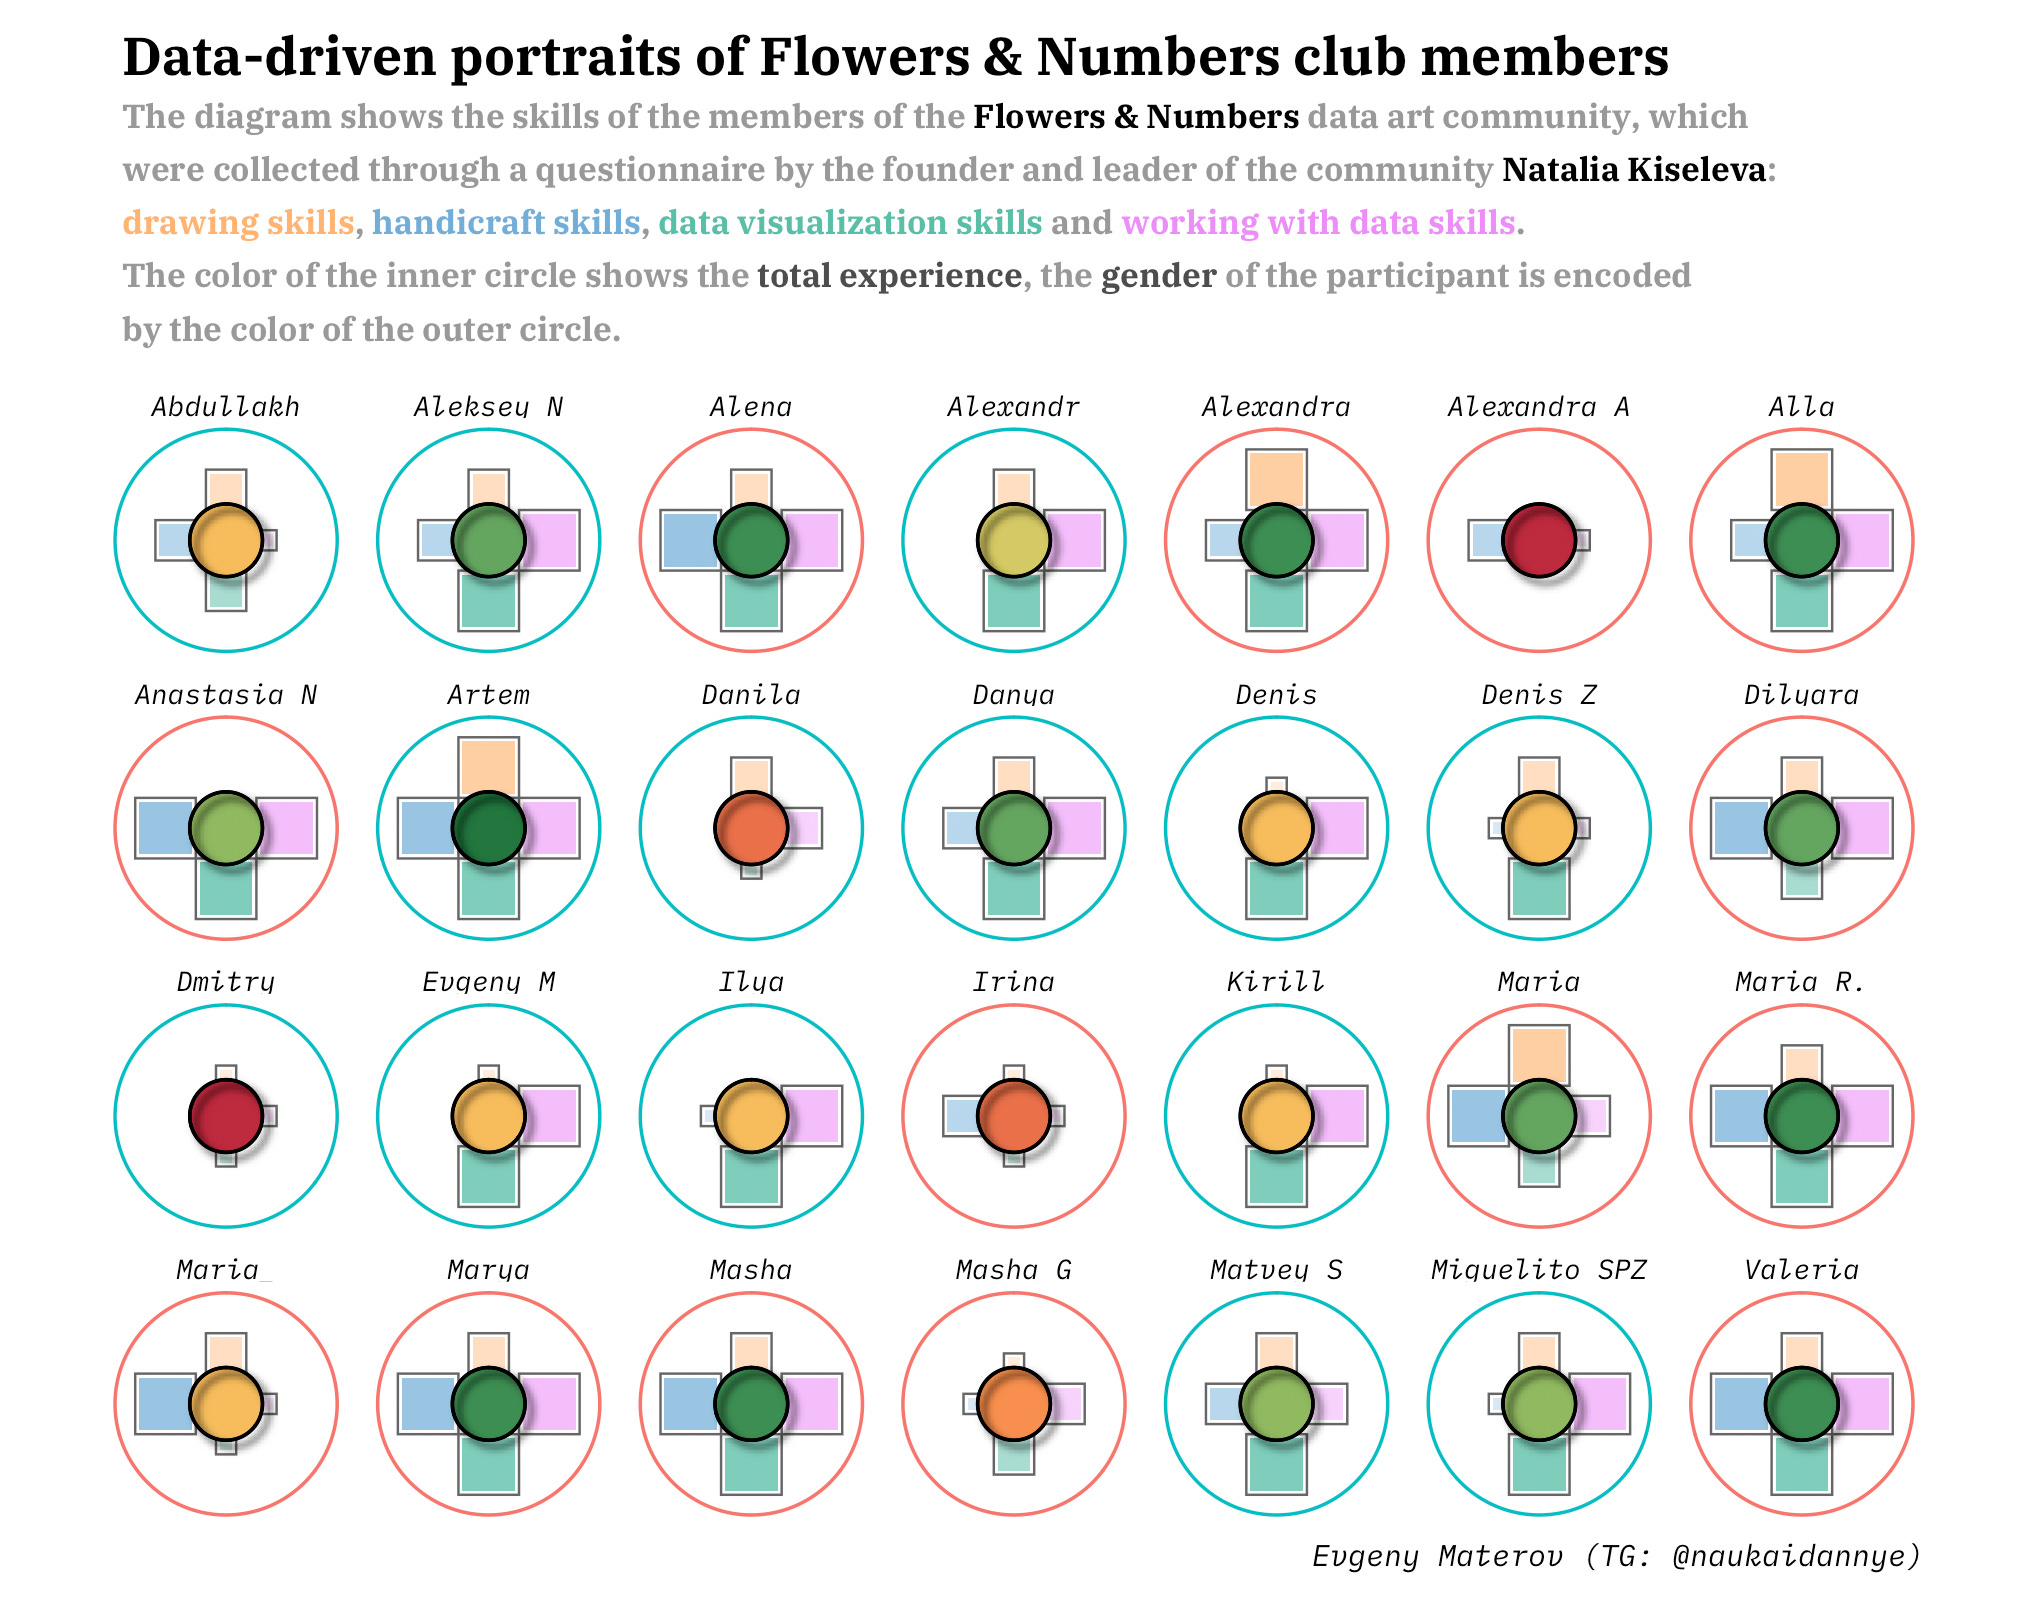
New Data Badges!
A separate joy is that our community project on the topic of data badges is ongoing! I want to tell you about two more projects:
One is made by Evgeny Materov - Head of the Department of Physics, Mathematics, and Information Technology. Check out these beautiful colors! Evgeny created a new variable - average skill level - and represented it with the color of the circle in the middle of a badge.
Alina Mironova, system analyst, neiroartist and our incredible member of the organizing committee, created badges using her skills in working with neural networks. She also changed the perspective on the absence or low level of skill, presenting it as an opportunity for growth!

World Data Art News
If you think that only the F&F participants were productive this week, not at all! Look at all the wonderful data art news and projects from around the world that I've gathered!
Music Data Art
Check this wonderful article by Guillermina Sutter Schneider from DataWrapper, where she tells us how to create data art about Music with DataWrapper. She was inspired by the works of the incredible Nicholas Rougeux!

Art of Commit History
Here is another incredible project! Visualization and data sonification of commit of the Python library PyTorch by Ren Yuan. Be sure to watch with sound for a truly immersive experience. And his website is stunning.
New Video with Giorgia Lupi!
A huge thank you to Jon Schwabish for organizing this podcast! It's such a pleasure to watch a video with such a guest and on such a wonderful topic!
Check it!
Data with Heart: Giorgia Lupi’s Journey from Visualization to Human Connection

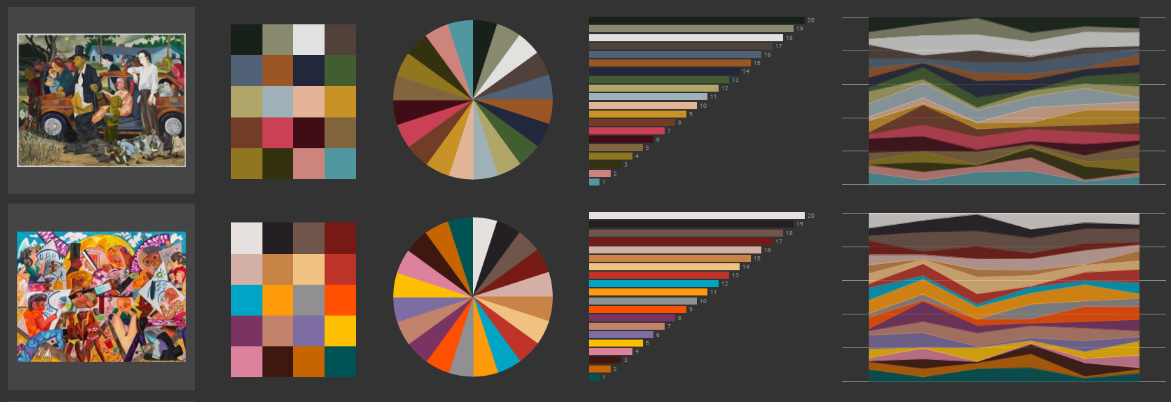
Data Palletes!
Recently, data artist Alex Varlamov updated his project in which he compiled palettes for data visualization based on famous paintings!
Check his pallet project here!
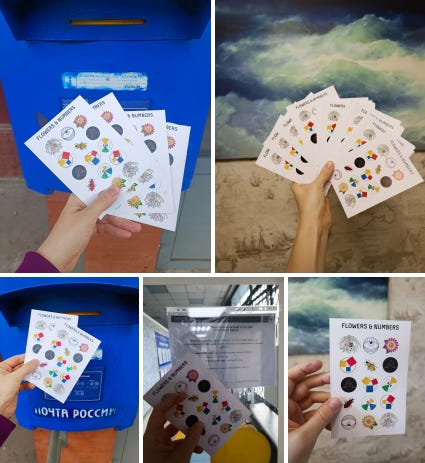
Postcard Adventures with F&F!
In our Flowers & Figures community, a spontaneous postcard project has emerged! It happened because I accidentally printed some postcards along with the t-shirts, and they turned out so cute that my dear fellow members also wanted to receive them!
It's been a long time since I sent paper letters and postcards! It's quite fascinating! At the same time, together with the postal workers, we are figuring out how many and which stamps are needed for a postcard to reach some exotic country. We are already quite an international community! This is no joke! 😂
But we wouldn't be a data art community if we didn't decide to turn the data on the directions of the letters into a separate project. So now I'm meticulously recording where and when the letters were sent, and maybe someone will send something back! In the end, it might turn into an interesting data art piece!
You can also participate in this project—send us a small donation and direct message me (or through any social network) with your name and address! I'll be happy to send you this beautiful postcard across seas and oceans! ❤️
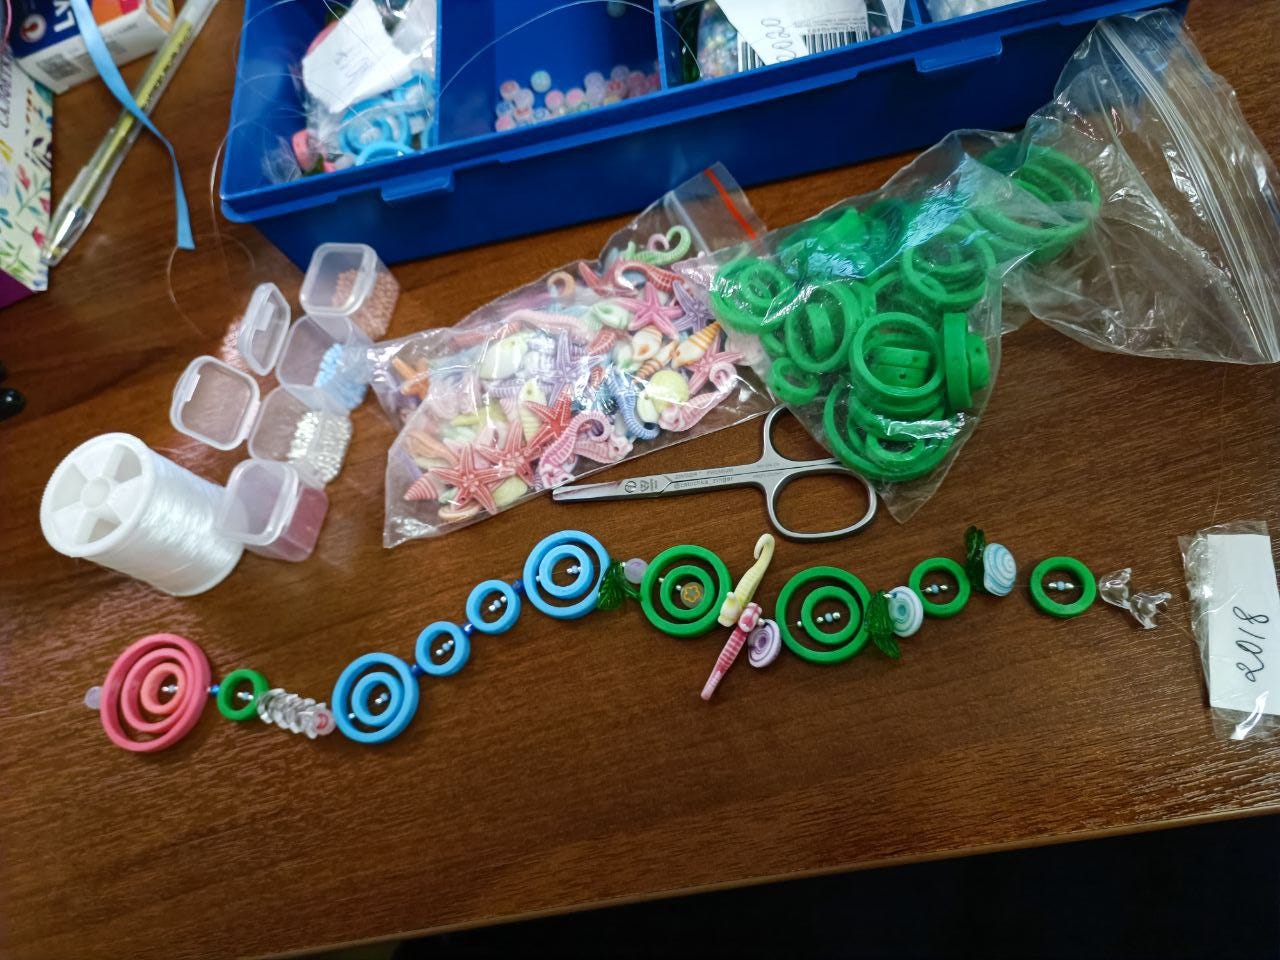
Protracted Journey!
Slowly but surely continuing my longest data art project about travels. I drew it a year and a half ago. A half year later I decided to materialize it. Another half a year was spent searching for possible ways to implement it! And so, this winter, I 3D-printed rings for the project and stocked up on lots of small trinkets, and threads to hang these rings with data.
Now I need to combine it all! Ten years of data (And I’m already in the middle)!
Here I described the drawn version, so you can roughly understand what it should turn out to be!
That’s it for today! Thank you for reading! 🌸
You can support our community with a donation or treat the author to a coffee at the link down here: