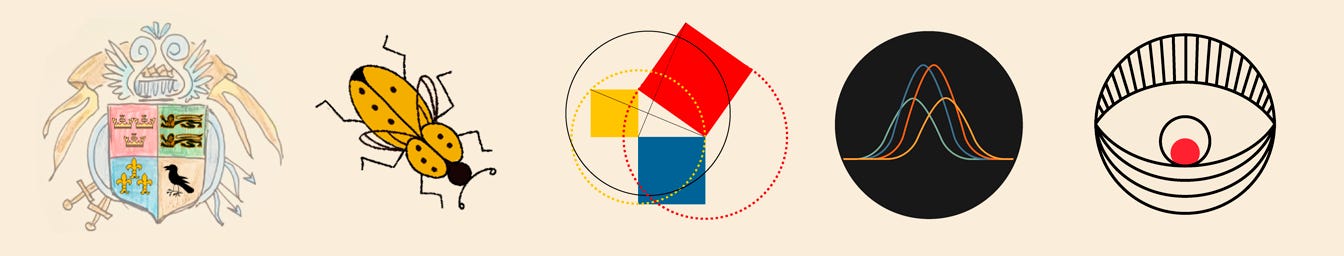
Hi, everyone! The other day, I hosted a live stream where I talked about how to distinguish data art from other projects. Once, I came across an algorithm from a Reddit public group – Data Art. I simplified it a bit, and this is the picture I came up with!
What do you think?
Drawn by Natalia Kiseleva
Flowers & Numbers - About!
Our member Ulyana interviewed several participants, asking them how they joined the community, what they do, and what they think about data art! Let's read their responses:
“I discovered the community thanks to Natalia's (eolay) streams about data art. I was immediately drawn to it, as all the discussions about data art inspired me to create more and more pieces.
At that time, I was working on my big project — the physicalization of football statistics, because I was studying at HSE as a Data Journalist during my Master's degree. Now, with my diploma almost in hand, I've started working as a Data Analyst (something I didn't expect, but here I am). I continue to live in Moscow.
To be honest, data art looks like the future to me. In this age of information and its products, we need to see meaningful things, not just beautiful pictures. It's no longer just about aesthetics. So I believe art will incorporate data art more.
Currently, I've accepted F&N's summer challenge and I'm excited to create another physicalization, this time about summer 2024. I can't wait to bring it to life!”
“I learned about F&N from Natalia's channel, which I've been subscribed to for a long time, and without much hesitation, I joined the group. People from different fields, with different backgrounds, have come together in a very warm and inspiring community.
For a long time, I admired other people's work, and at some point, I decided to try creating my own. So far, they're mostly simple personal stories: about the cities I've lived in, about time spent with loved ones, about my physical activity, my mood during a certain period. I have many ideas. They come to mind almost every day; while pondering one, another one is born. But not all of them have enough time and energy.
I'm a graphic designer specializing in data visualization. I've always enjoyed delving into numbers and finding the most suitable way to convey their essence, avoiding distortions and making them easier to understand. But data art is a special world: here, there's a lot of creativity, freedom, and beauty.”
Thanks for reading Flowers & Numbers! Subscribe for free to receive new posts and support my work.
World Data Art News
Perhaps you haven't seen Giorgia Lupi's new project! For the "Democracy Renewal: Women Leading" summit at Wellesley College, Giorgia Lupi created visual Data Portraits. These colorful icons with graphic motifs were based on participants' responses to simple yet profound questions. I adore her data icons; they are always so incredible!
What a splendid canvas! You'll be amazed—it's a magnificent data art piece by Zainab Ayodimeji dedicated to artists and the Museum of Modern Art!
Fragment of the MoMA project by Zainab Ayodimeji
Data Art Puzzles!
Two wonderful data-art Puzzle projects from Shangita Bose and her classmate!
You can read more about the projects at Shangita’s LinkedIn and check out the legend of this quest! Looks very mysterious, I adore such projects!
Photos from Shangita’s LinkedIn
Flowers&Numbers News: Merchandise!
More great news - we've launched our first merchandise! It includes T-shirts and postcards that have already started traveling around the world! I hope we'll soon gather a special post-project around this. Our community members are taking these items to all corners of the globe!
Mockup made by Nadya Andrianova, photo by Natalia Kiseleva
The Art of Visualizing Data
Hana M. K. from The Art of Communicating with Data podcast invited me to her regular video stream for data people about data people.
We had a heartfelt chat recently, and I even took a heroic friend selfie with her. Many of my stories and tips resonated with her, so I'm excited to share my journey into data art, visualization, comics, and our wonderful community F&F!
Screenshot made by Natalia
Amazingly, they managed to gather data for a whole year - that's heroic! I also love the idea of collecting emotions and encoding them in colors, observing the dynamics. My project, "Diary of Emotions", features data for just one month. But a year! Wow!
I quickly gathered the data and sketched the layout in half a day. I made several drafts and selected marker colors.
Then I spent six months agonizing over the fact that I can't do landscapes, I can't draw with markers, and I especially can't draw mountains with markers... You can read the details about this project here!
What did you see among the trees?
Drawn by Natalia Kiseleva with markers
Data Walk & Physical Data Art Workshop
And here's another incredible update! In St. Petersburg, our community held a physical data art workshop focusing on material data art! Nadya came all the way from Moscow to showcase her favorite techniques! It was truly fantastic, and I'll share the results once the projects are completed! Also, Ulyana guided us through a historical center data walk, where we gathered data too! Not a day without a project! Let's meet up! Let's communicate!
Photos made by Nadya and Natalia
That’s it for today! Thank you for reading!
You can support our community with a donation or treat the author to a coffee at the link down here: 🌸


